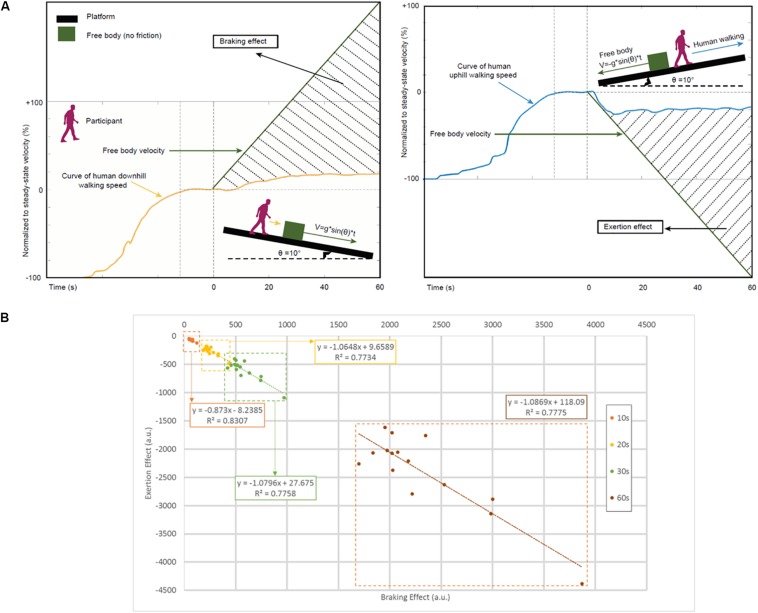
FIGURE 3.
The relation of locomotion and gravity while walking in inclined planes. (A) Schematic characterization of the braking (left panel) and exertion (right panel) effects. We introduce a new measure for estimating braking (positive values) and exertion (negative values) effects by calculating the shaded area using numerical integration (Supplementary Figure S1 and section Materials and Methods). Free body velocity was rescaled to permit graphical comparison on the same scale as the walking data. (B) Relationship between braking effect and exertion effect. Scatterplots and linear regression lines for the relationship between estimated braking and exertion effects in study participants included separate time windows covering the entire experimental period: at 10 s (orange), 20 s (yellow), 30 s (green), and 60 s (brown) post-transition from steady-state velocity. Regression equations and r-squared values are shown. The correlations represented in these data suggest similar volitional effort to counteract the natural tendencies imposed by gravity in uphill and downhill walking. a.u., arbitrary units.

