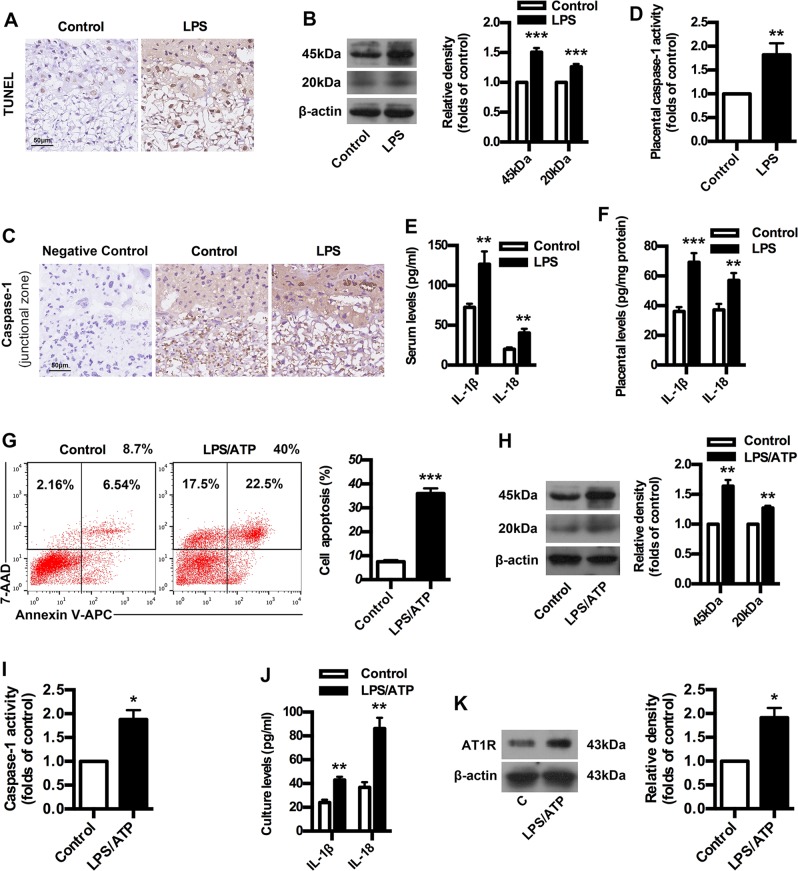
Fig. 2. Caspase-1 activation, pyroptosis and AT1R exposure in PE mice and trophoblast model.
a Comparison of trophoblast death between control and PE mice. TUNEL analysis in placenta was shown. Bar = 50 μm. b, c Comparison of placental caspase-1 expression between control and PE mice. WB (b) and IHC (c) analysis of caspase-1 in placenta were shown. The histogram represents means ± SEM of the densitometric scans for protein bands (n = 7 mice in each group), normalized by comparison with β-actin and expressed as a percentage of Control. Bar = 50 μm. d Comparison of placental caspase-1 activity between control and PE mice. Comparison of IL-1β and IL-18 levels in serum (e) and placenta (f) between control and PE mice. IL-1β and IL-18 were detected by ELISA. Results are expressed as means ± SEM (n = 7 mice in each group). **p < 0.01 and ***p < 0.001 versus control group, two-tailed Student’s t test. g Effect of LPS/ATP on trophoblast apoptosis. Human first-trimester trophoblast cell line HTR-8/SVneo was treated with LPS and ATP. Cell apoptosis was detected by using flow cytometry. h Effect of LPS/ATP on trophoblast caspase-1 expression. Caspase-1 was detected by WB. i Effect of LPS/ATP on trophoblast caspase-1 activity. j Effect of LPS/ATP on trophoblast IL-1β and IL-18 levels. IL-1β and IL-18 were detected by ELISA. k Effect of LPS/ATP on trophoblast AT1R exposure. AT1R was detected by WB. Results are expressed as means ± SEM from three independent experiments. *P < 0.05, **P < 0.01 and ***P < 0.001 versus control group, two-tailed Student’s t test.

