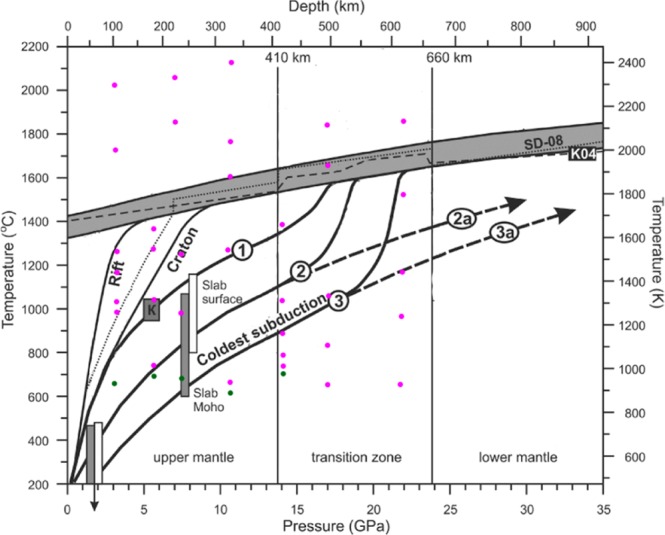
Figure 8.

PT-range of hydrocarbon formation from propane in laser heating DAC experiments in comparison with mantle PT-profiles provided in the diagram taken from42. The pink dots represent the chemical transformations of propane, while the green – its stability.The gray field is the range of mantle adiabats with potential temperatures 1315–1415 °C. The dashed line represents the K04–1400 °C adiabat43. The dotted line depicts the average mantle thermal model44. 1- hottest subduction, 2- medium subduction, 3 – coldest subduction stagnant in the transition zone and penetrating into the lower mantle (2a and 3a)45,46.
