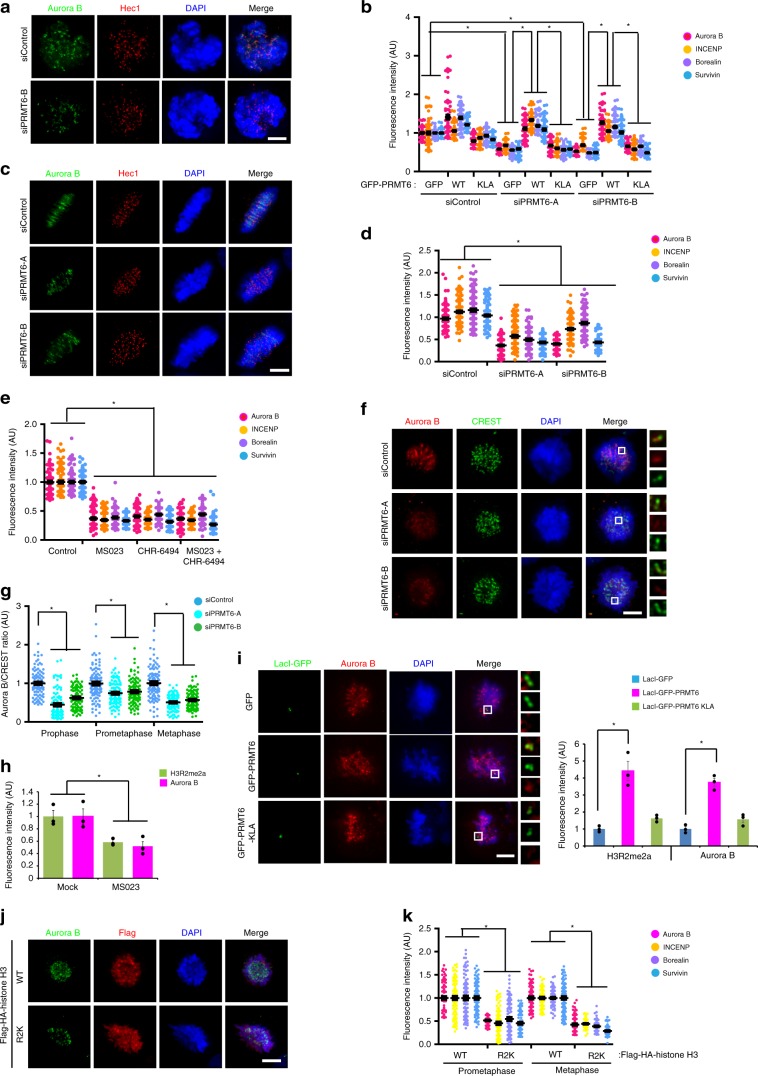
Fig. 3. H3R2 methylation is essential for CPC targeting to centromeres.
a, b After depletion of PRMT6 with siRNA, the cells were transfected with indicated plasmids and the intensity of the CPC components in PRMT6-depleted prometaphase HeLa cells was determined at centromeres from 10 prometaphase cells (n = 100 centromeres from three independent experiments). c, d The intensity of CPC components in PRMT6-depleted metaphase HeLa cells was determined at centromeres from 10 mitotic cells (n = 150 centromeres form three independent experiments). e The cells were treated with the MS023 as a PRMT6 inhibitor and/or the CHR-6494 as a Haspin kinase inhibitor. The intensity of the CPC components was determined by immunofluorescence microscopy and plotted (n = 100 centromeres from three independent experiments). f, g After depletion of PRMT6 with siRNA, prometaphase RPE1 cells were stained with indicated antibodies (f). The intensity of Aurora B in PRMT6-depleted RPE1 cells was determined at centromeres from 10 mitotic cells (g, n = 100 centromeres from three independent experiments). h Eighteen hours after nocodazole arrest, the HeLa cells were treated with the PRMT6 inhibitor for one hour and the fluorescence intensity of H3R2me2a and Aurora B was analyzed and plotted (n = 30 prophase cells from three independent experiments). i LacO/TRE U2OS cells were transiently transfected with LacI-GFP-PRMT6 WT or KLA mutant. The cells were fixed 28 h after transfection. The presence of Aurora B was evaluated using antibodies against endogenous Aurora B and the average intensity of the Aurora B was analyzed and plotted (n = 30 prometaphase cells from three independent experiments). The insets show single focal planes of the boxed regions. j, k After transfection of Flag-histone H3 WT or R2K mutant, the intensity of the CPC components was determined (n = 100 centromeres from three independent experiments). Scale bars, 5 μm. Error bars, SEMs. P values were calculated by two-tailed Student’s t-tests (d, e, g, h, I, and k; *p < 0.01) or two-way ANOVA (b; *p < 0.01). Source data are provided as a Source Data file.

