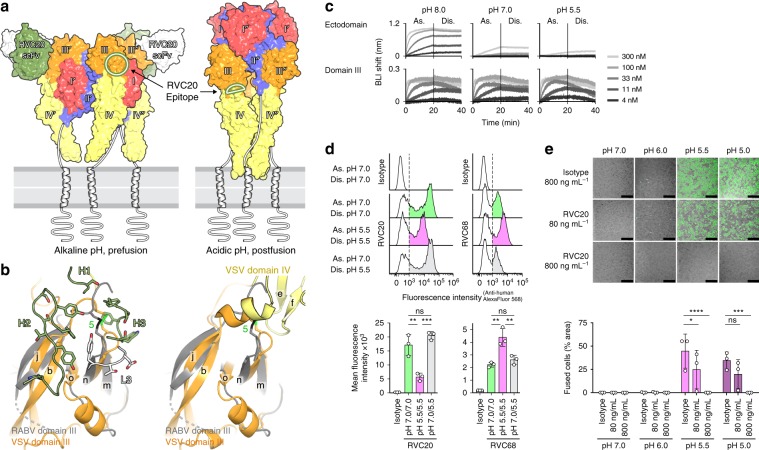
Fig. 3. RVC20 locks RABV G in its prefusion state.
a Structure of the trimeric VSV G in its alkaline-pH prefusion11 (left) and the acidic-pH postfusion conformation10 (right) color-coded according to domains, as labeled. The RVC20 scFv/RABV G domain III complex was superposed onto VSV G domain III, and only the RVC20 moiety is shown. For clarity, the scFv is not shown on the front protomer, in which a circle marks the location of its epitope. The right panel shows that the epitope should become occluded by domain IV after the acidic-pH-triggered conformational change of G. b Detail of the VSV G region corresponding to the epitope (orange) superposed onto RABV G domain III (gray). The CDRs making the RVC20 paratope (green and white) are shown on the left panel. The right panel shows that the epitope is not accessible at acid pH, as domain IV buries a substantial part of the epitope area. The orientation is as in Fig. 1d. c Association (As.) and dissociation (Dis.) of the recombinant ectodomain (aa 1–403) or domain III alone (aa 31–56/182–262) to immobilized RVC20 at different pH values as determined qualitatively by biolayer interferometry (BLI). d Binding of RVC20 (left) or poorly neutralizing RVC68 (right) to RABV G-expressing HEK 293T cells in suspension. Association (As.) and washing (Dis.) was performed at the indicated pH values, and binding was assessed by flow cytometry in comparison to an isotype control mAb (top). The mean fluorescence intensity of mAb-bound cells (shaded area in histograms) is shown for n = 3 independent experiments (bottom). e Fusion inhibition by RVC20 in a GFP-split cell–cell fusion assay. Fusion of RABV G-expressing HEK 293T cells was determined upon exposure to the indicated pH in the presence of a nonspecific isotype control mAb or RVC20 at concentrations of 80 or 800 ng mL−1; n = 3 independent experiments. Data are displayed as means ± s.d. Statistical analysis was performed using Tukey’s test with α = 0.05. ****P < 0.0001; ***P < 0.001; **P < 0.01; *P < 0.05; ns not significant (P > 0.05). Scale bars: 200 µm. Source data are provided as a Source Data file.

