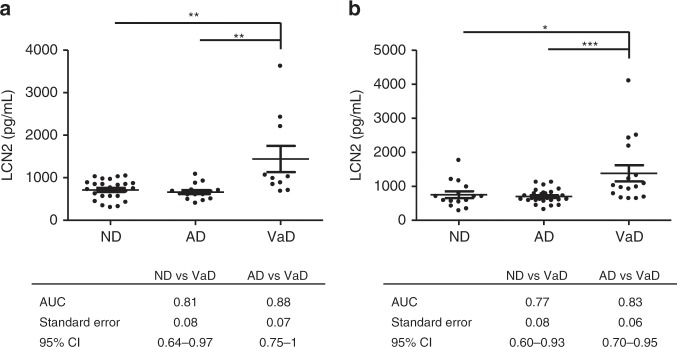
Fig. 2. Diagnostic accuracy of CSF LCN2 in the discrimination of VaD and AD (cohorts 2 and 3).
a Cohort 2: LCN2 concentrations in non-primarily neurodegenerative and non-ischemic neuropsychiatric diseases (ND, n = 24), Alzheimer’s disease (AD, n = 15), and vascular dementia (VaD, n = 10). Area under the curve (AUC) derived from receiver operating characteristic (ROC) curves, Standard Error, and 95% CI in the comparative analysis of VaD versus ND and AD. b Cohort 3: LCN2 concentrations in ND (n = 15), AD (n = 27), and VaD (n = 16). AUC derived from ROC curves, Standard Error, 95% CI in the comparative analysis of VaD versus ND and AD. Differences between groups were analysed with Tukey contrasts using linear regression models controlled for age and sex. *p < 0.05, **p < 0.01, ***p < 0.001.

