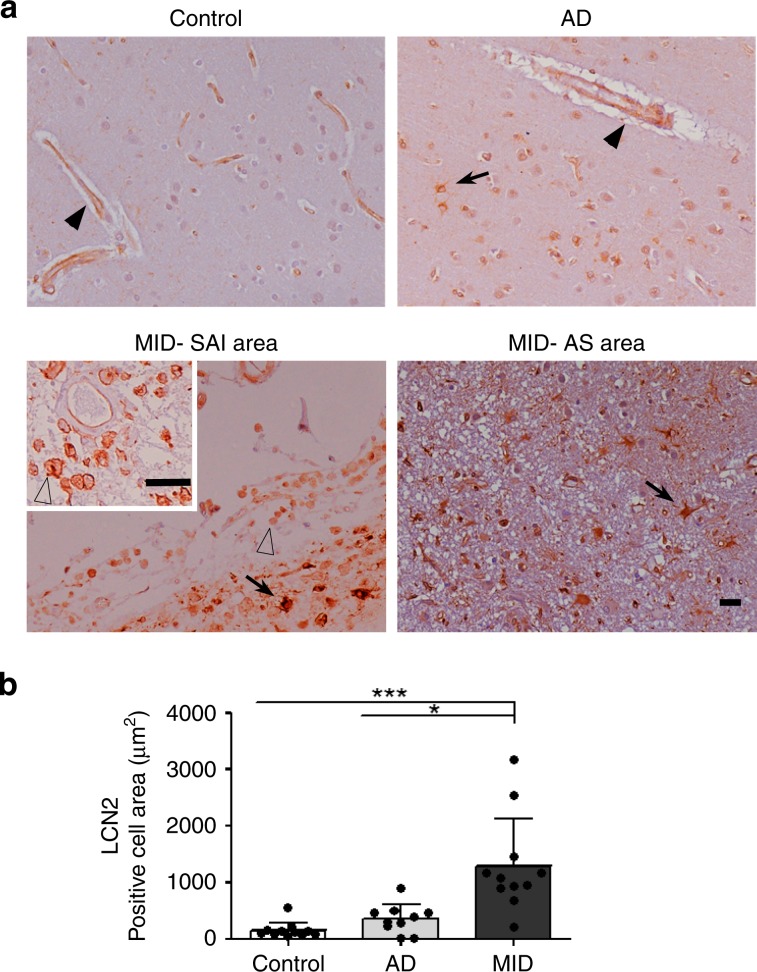
Fig. 4. LCN2 expression in control, AD, and MID brain tissue.
a LCN2 immunohistochemistry in the cerebral cortex of control, Alzheimer’s disease (AD), and Multi-Infarct Chronic Encephalopathy (MID) cases, including subacute infarct areas (MID-SAI area) and astrocytic scar areas (MID-AS area). LCN2 staining is observed in intact blood vessels in controls, AD and MID cases (arrow-heads). Increased LCN2 expression is observed in reactive astrocytes in AD and MID (arrows) and in monocyte/macrophage cells of the MID-SAI area (empty arrow-heads). Paraffin sections counterstained with hematoxylin. Bar: 25 µm; insert-bar 50 µm. b Quantification of LCN2 positive cells area in cerebral cortex and striatum in µm2. Significant increase of LCN2 positive cells area in MID cases with respect to controls (***p < 0.001) and AD cases (*p < 0.05). Shown results are means (±SD) of controls (n = 11), AD (n = 10), and MID (n = 11) cases. In MID cases, area of subacute infraction (n = 6) and chronic infarcts (n = 11) were analysed. Results were analysed by Kruskal-Wallis followed by Dunn's Multiple Comparison test.

