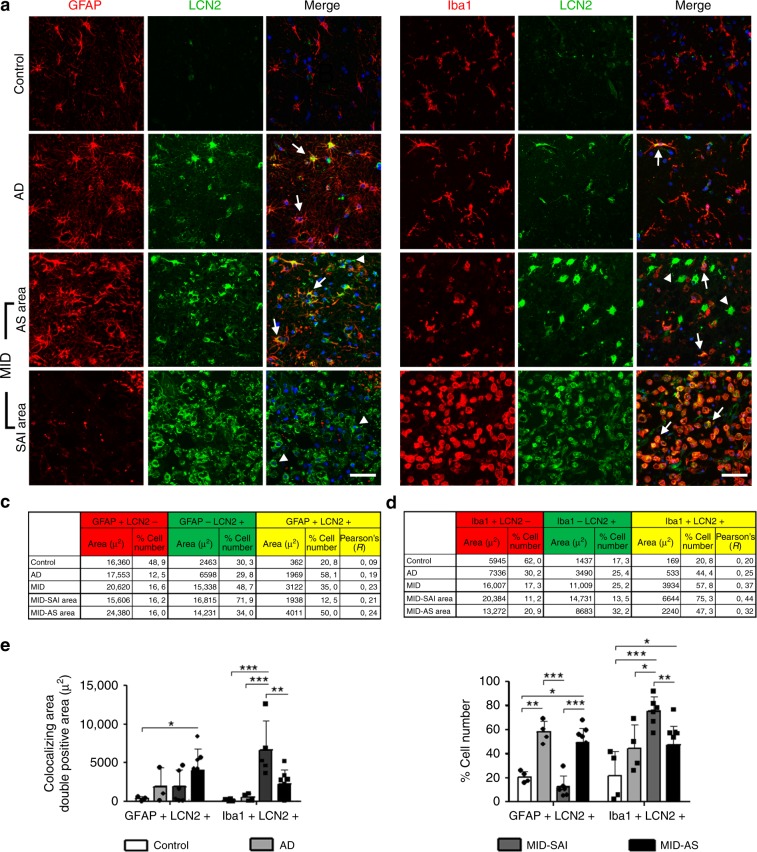
Fig. 5. LCN2 expression in brain tissue and association with glial markers.
a LCN2 and GFAP double-immunostaining in the cerebral cortex of control, AD, and MID cases. LCN2 co-localises with GFAP immunoreactive astrocytes (arrows) in AD, with surrounding plaque like structures, and in MID in astrocytic scar area (MID-AS). Abundant LCN2+GFAP- cells are observed in MID at the subacute infarction area (MID-SAI; arrow-heads), where there is little astrocyte presence. Bar = 50 µm. b LCN2 and Iba1 double-immunostaining in the cerebral cortex of control, AD, and MID cases. LCN2 co-localises with Iba1 immunoreactive microglia in AD and MID-AS (middle panels, arrows). In MID-SAI, predominant Iba1 positive staining was observed, displaying almost entire colocalisation with LCN2+ cells (bottom panel, arrows). LCN2+Iba1- cells are observed in MID-AS slices (arrow-heads). Bar = 50 µm. c, d Quantification of (c) LCN2 and GFAP, and (d) LCN2 and Iba1 double-immunostainings. Tables show single- and double-stained area (µm2), percentage of cells and Pearson’s colocalisation coefficient in Control, AD, and MID (total and divided in MID-SAI and MID-AS). e Graphic representation of double-stained area (left panel) and percentage of double-stained cells (right panel) in control, AD, MID-SAI, and MID-AS. Data are shown as mean ± SD of control (n = 4), AD (n = 4), and MID (n = 10). MID-AS areas were quantified in 10 cases and MID-SAI areas in 6 cases. Mean ± SD is included for each graph. Two-way ANOVA followed by Bonferroni’s post hoc test were used to analyse results *p < 0.05, **p < 0.01, ***p < 0.001.

