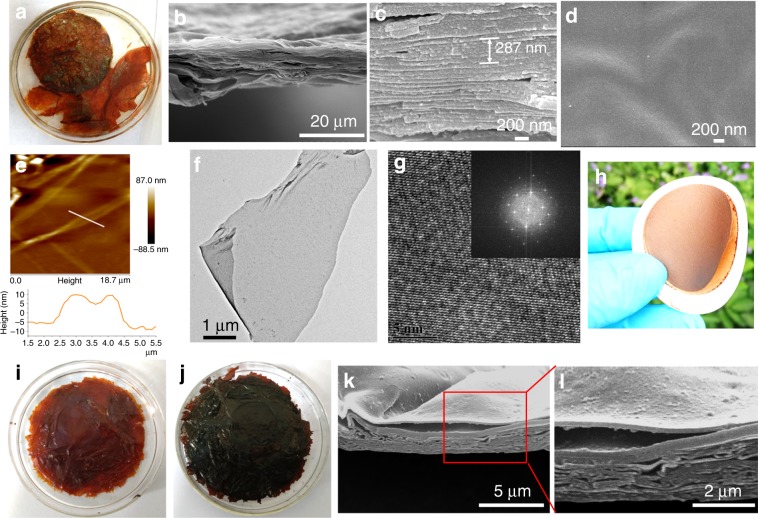
Fig. 2. Morphology characterizations.
a Pristine FS-COM-1 collected from the organic–organic solvent interface. b, c Cross-section SEM images of FS-COM-1. d Top-view SEM image of FS-COM-1. e AFM image and the thickness of the nanosheet. f TEM image of the nanosheet with micrometer scale. g High-resolution TEM patterns. h Digital images of substrate-supported membrane (FS-COM-1-VF). i Pristine FS-COM-2 collected from the organic–organic solvent interface (soaked in acetone). j Pristine FS-COM-2 collected from the organic–organic solvent interface (soaked in water). k, l Cross-section SEM images of FS-COM-2. Enlarged view of the inserted red box in k is shown in l.

