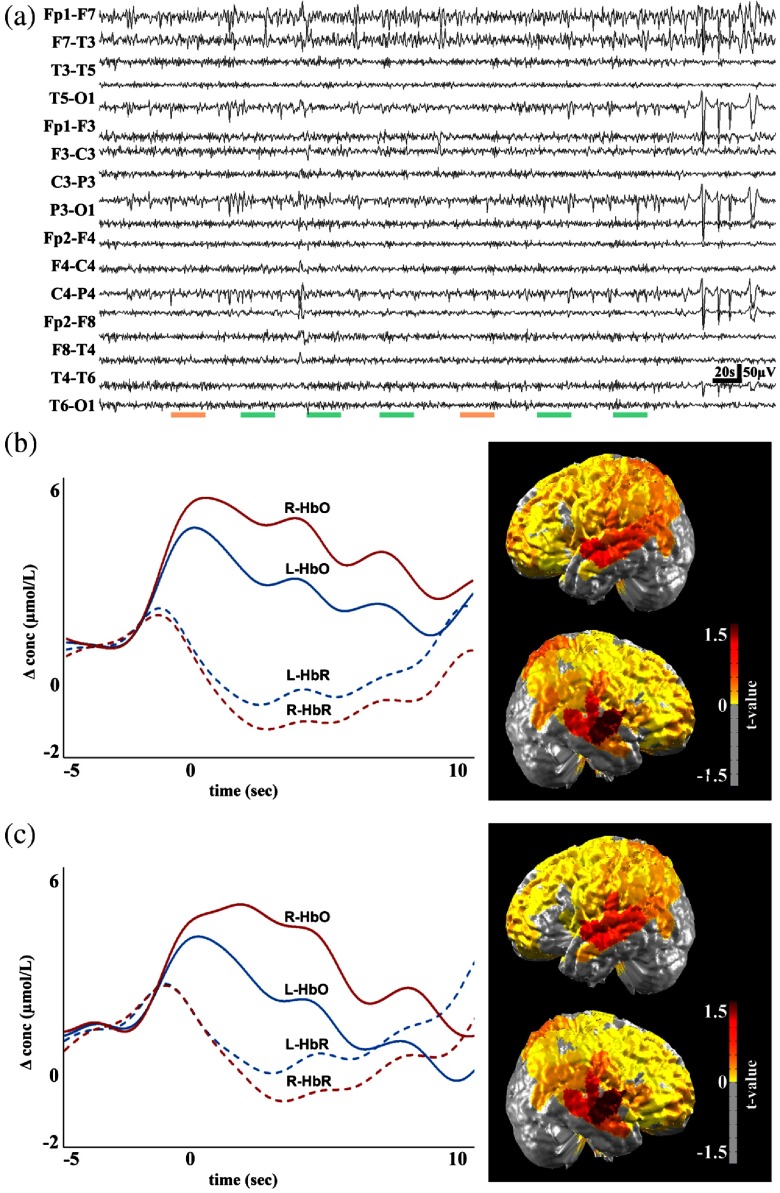
Fig. 2.
Multimodal recordings from patient 10, a 43-year-old male. On the day of the recording, the patient experienced multiple seizure events ranging from duration of 3 to 10 s, with an average duration of 7 s. The analyzed EEG recording is shown in (a), with the colored green bars representing seizure events and false positives denoted by orange horizontal lines. The hemodynamic response to marked events and network events (with false detections) and the corresponding cerebral topographic analysis are shown in (b) and (c). Red and blue curves represent oxygenated (HbO) and deoxygenated (HbR) hemoglobin, respectively. Solid red and blue and dashed red and blue lines correspond to the right (R- ) and left (L- ) side of the brain, respectively.

