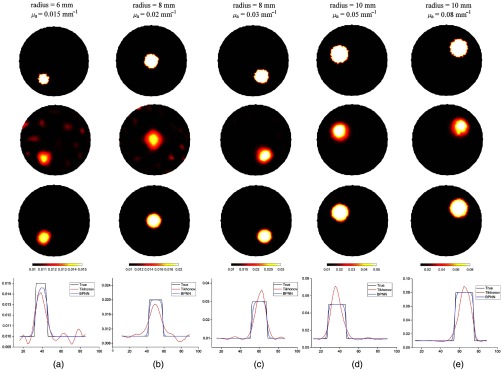
Fig. 3.
(a)–(e) Reconstructed images of a single inclusion with different sizes and different values of absorption coefficients. The first row is the true images, the second and third rows are the recovered images using Tikhonov regularization and BPNN, respectively. The last row is the corresponding profiles through the center of inclusions and along axis. The sizes and the true values of absorption coefficients for each case are shown at the top of the figure. The reconstructed images of each column are shown at the same scale.

