. 2019 Nov 20;28(1):36–47. doi: 10.4250/jcvi.2019.0079

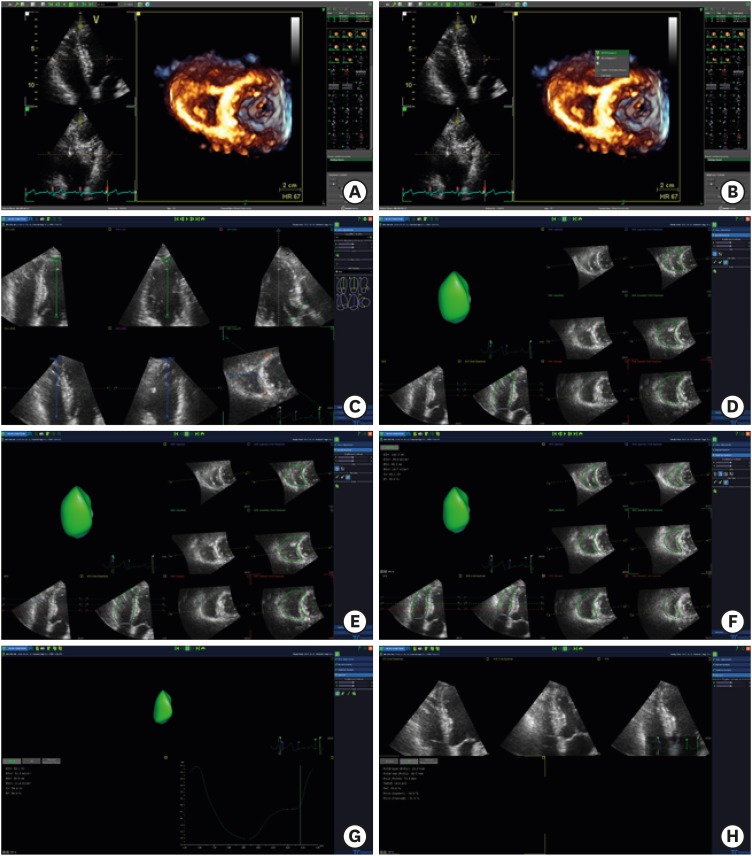
Figure 1. Example of RV 3D analysis using the TomTec 4D function. (A) Select the RV focused 4-chamber view, including LV apex and MV. (B) Click on the right mouse button on the image and click the “4D RV function”. (C) When the multi-planar images are shown, put a dot on the LV apex, MV, RV apex, tricuspid valve, aortic valve, and anterior and posterior junctions of RV-LV. Then, click ‘beutel revision’. (D) Observe the diastolic RV image, adjust the RV borders, and click the ‘tracking revision’ button. (E) Observe the modified RV data that are shown. (F) Systolic RV data were also acquired using the same process. (G) After this process, RV volume curves were shown. (H) Click the “2D” button on the left side to display the parameters of 2D. LV: left ventricle, MV: mitral valve, RV: right ventricle.

Figure 1