
Fig. 2.
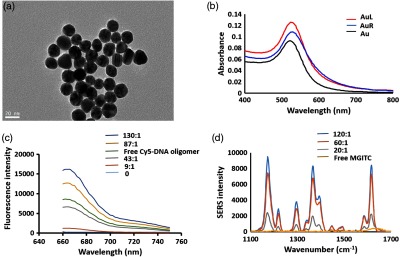
(a) TEM image of AuNPs. (b) UV–-vis spectra for bare AuNP and DNA oligomer (left and right) conjugated AuNPs in PBS. (c) Fluorescence spectra of free Cy5-tagged-left DNA oligomers (green line) and the standard solutions of five different molar ratios of Cy5-tagged-left DNA oligomer to Au NPs (blue 130:1, yellow 87:1, gray 43:1, red 9:1, and sky 0). (d) SERS spectra of free MGITC (yellow line) and their standard solutions of MGITC dye ratio to AuNPs from 120:1 to 20:1.