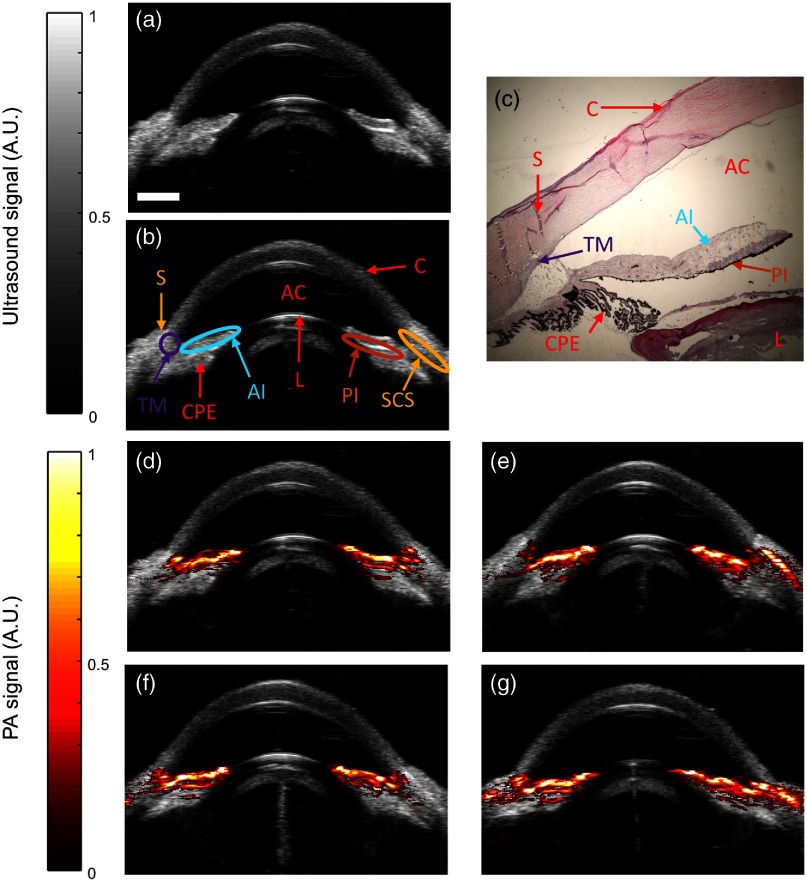
Fig. 1.
Visualization of anatomy and PA signals in the anterior segment. (a, b) Grayscale ultrasound images showing anatomy of the ex vivo porcine eye. S, sclera; AC, anterior chamber; C, cornea; L, lens; TM, trabecular meshwork; AI, anterior iris; PI, posterior iris; SCS, suprachoroidal space; CPE, ciliary pigmented epithelium. (c) Corresponding histologic image of the porcine anterior segment stained with hematoxylin and eosin. (d–g) Overlay of ultrasound (gray) and PA (red) images at different locations (scans at 0 deg, 45 deg, 90 deg, and 135 deg) at . PA signals appeared at melanin-rich regions, such as the TM and throughout the iris. PA signals consistently appeared at the same anatomical landmark in all frames. Scale bar for .

