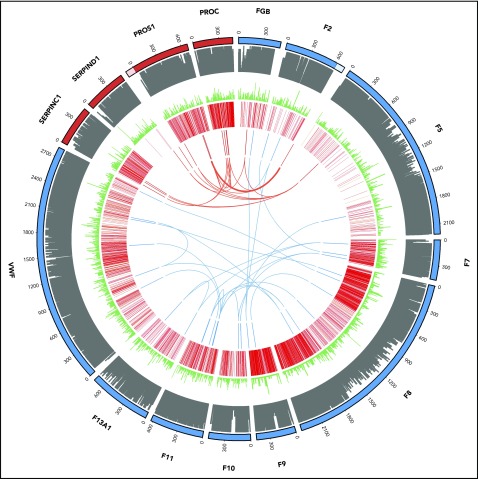
Figure 4.
Oligogenic variants in patients with thrombotic (red) and coagulation (blue) disorders. From outside to inside: track 1, amino acid numbering for thrombotic (red) and coagulation (blue) genes (lighter shade denotes untranslated regions of the 3′ of the F2 gene and the 5′ of the PROS1 gene; track 2, amino acid conservation scores; track 3, variant frequency in gnomAD (minor allele frequency normalized scale to 1/106); track 4, disease-causing (red) and questionable disease-causing (orange) Human Gene Mutation Database variants; track 5 and arcs: reported variants in the 11 thrombotic (red) and 13 coagulation (blue) patients with the arcs representing oligogenic findings.

