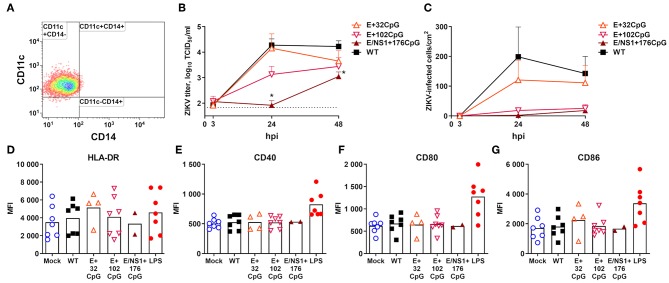
Figure 5.
Virus infection kinetics in human moDCs after inoculation at MOI of 1. (A) MoDCs were generated from blood cells of eight adult females sampled at birth or shortly before birth and one adult male. Differentiation of CD14+ monocytes from human blood resulted in a typical moDC phenotype. In this experiment, we excluded the permuted ZIKV variant because the number of moDCs was limited. (B) An asterisk (*) denotes a statistically significant difference between WT and E/NS1+176CpG ZIKV variants. The dotted horizontal line represents the limit of detection. (C) The 96-well plates with moDC cells were stained with ZIKV-specific Abs and ZIKV-infected cells were counted in the well with bright-field microscopy at 200x (Figure 4). Whiskers represent SE from nine donors with two technical replicates. (D–G) Expression of flow cytometry markers in moDCs inoculated with ZIKV variants (MOI = 1) and measured at 48 h post inoculation. Bars represent mean values. LPS (100 ng/ml Lipopolysaccharide; Sigma L5418) was used as a positive control. MFI, mean fluorescent intensity; hpi, hours post inoculation.

