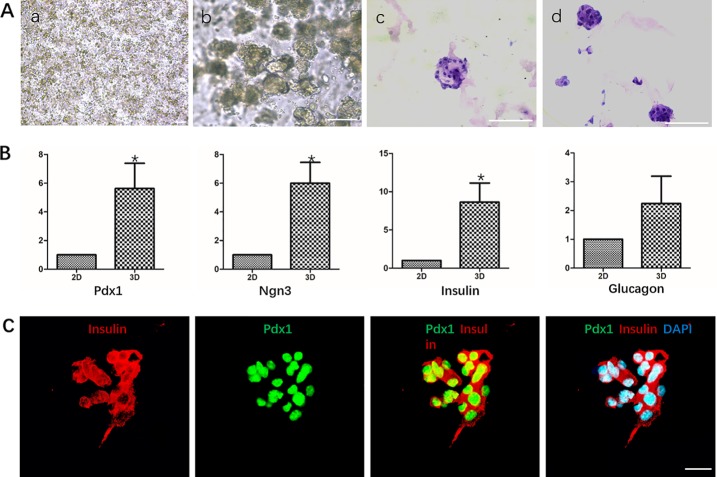
Figure 5.
Differentiation of hDPSCs into IPCs in Matrigel. (A) Analysis of the growth morphology of hDPSCs in Matrigel. a. Matrigel physical embedded cells before induction; b. Growth status of cells in Matrigel after induction; c-d. HE staining analysis of different cell aggregates after induction. Scale bars: 20 μm. (B) Gene expression analysis Pdx1, Nkx6.1, Insulin and Glucagon by qPCR. Cells in 2D group were used as control. Results are the average of three independent experiments. *p < 0.05. (C) Immunostaining of pancreatic cell markers Pdx1 and Insulin on day 19. Scale bars: 20 μm.

