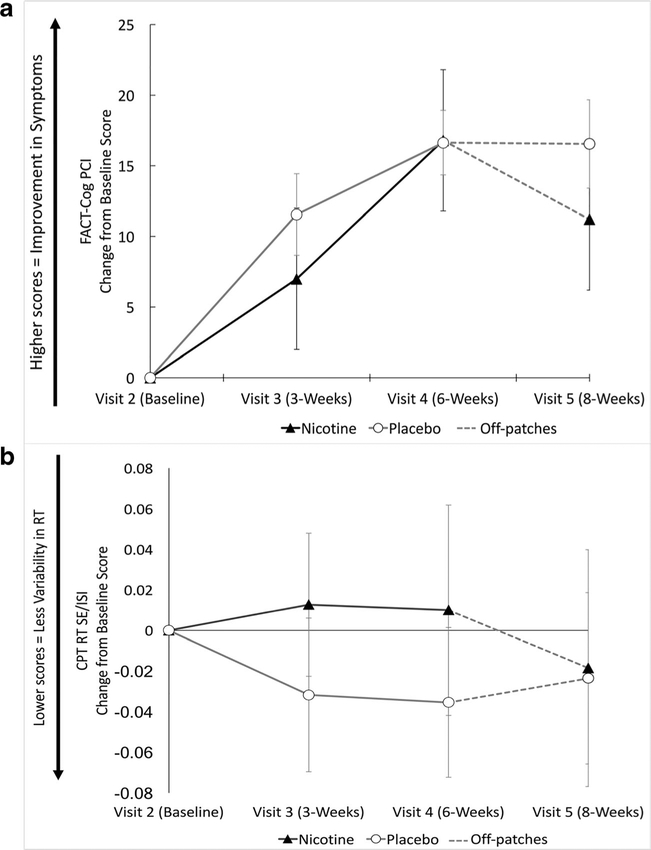
Fig. 2.
Results for primary analyses. a Study aim 1: FACT-Cog Perceived Cognitive Impairment (PCI) change from baseline scores. Positive change scores indicate improvement in symptoms. b Study aim 2: Conners’ continuous performance task (CPT), reaction time (RT), and standard error (SE) divided by interstimulus interval (ISI) change from baseline scores. Negative change scores indicate improved performance. In both graphs, treatment groups are distinguished by the following colors: nicotine (black triangles) and placebo (white circles). The gray dashed lines indicate that participants were off patches between visits 4 and 5. Error bars indicate SE

