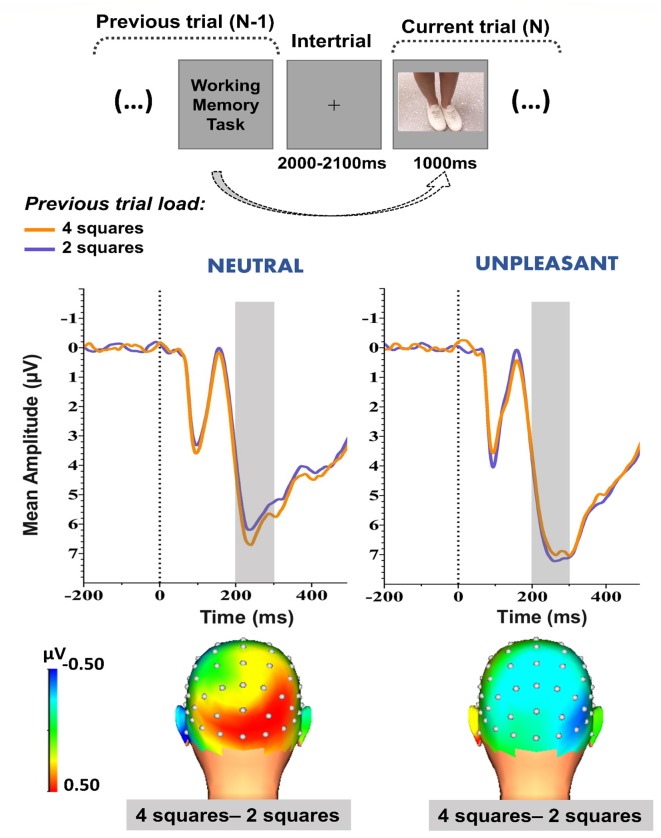
Figure 2.
Upper panel: Schematic representation of the proposed method to evaluate the effects of the WM task’s previous trial demand on the images’ neural response. Middle panel: Early (200–300 ms) grand-average waveforms (collapsed across P7, P8, PO7, PO8, O1, Oz, and O2 electrodes) obtained during the high-load (four squares) and low-load (two squares) previous trial conditions. The shaded area represents the time window applied for analysis. Lower panel: 3-D topographic maps of the differences in the waveform mean amplitudes (200–300 ms) between high-load and low-load previous trial conditions. Neutral and unpleasant condition waveforms and topographic maps are depicted on left and right panels, respectively.

