Figure 2.
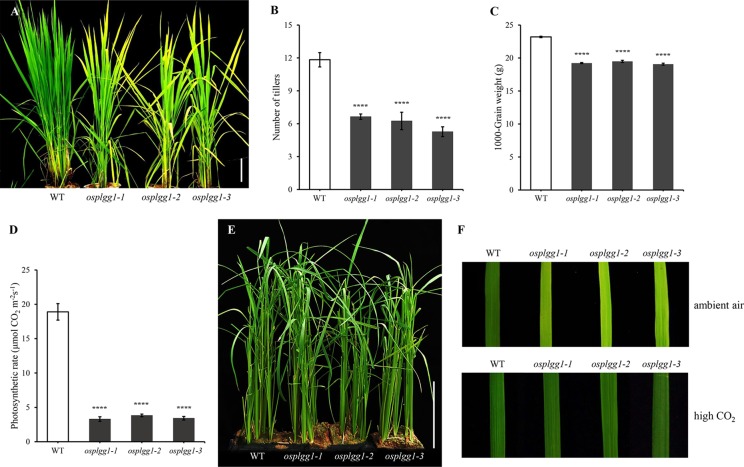
Phenotype analysis of osplgg1 mutants. (A) Mature plants of WT, osplgg1-1, osplgg1-2 and osplgg1-3 mutants grown for 2 months in the paddy field. Bar = 10 cm. (B, C) Number of tillers (B) and 1000-grain weight (C) of WT, osplgg1-1, osplgg1-2, and osplgg1-3 plants. The experiment consisted of five independent plants per each line. Error bars indicate the standard error of the mean (SEM). ****P < 0.0001. Student's t-test was used to show statistical differences. (D) Photosynthetic carbon reduction rate of WT, osplgg1-1, osplgg1-2, and osplgg1-3 in leaves of 1-month-old WT and osplgg1 mutant plants grown in the paddy field. Four independent biological replicates were used in the experiment, each having three technical replicates. Error bars indicate SEM. ****P < 0.0001. (E) Phenotypic recovery of osplgg1-1, osplgg1-2, and osplgg1-3 mutant plants grown under high CO₂ condition for 1 month in an environmental growth chamber. Bar = 10 cm. (F) Leaf blades of WT, osplgg1-1, osplgg1-2, and osplgg1-3 plants grown under ambient air (top) or high CO₂ condition (bottom) for 3 weeks in an environmental growth chamber.

