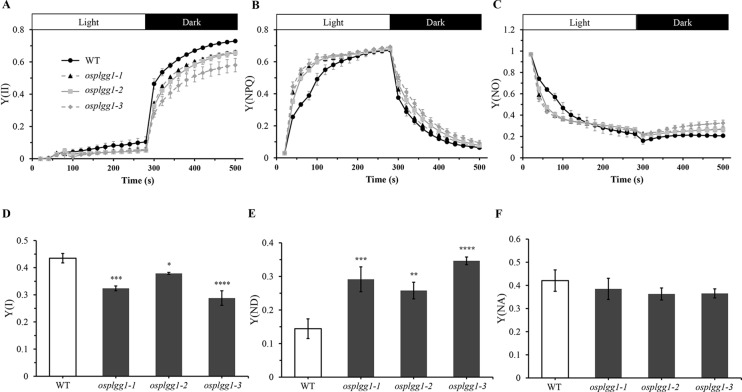
Figure 3.
Analysis of PS II and PS I activities of osplgg1 mutants, osplgg1-1, osplgg1-2, and osplgg1-3. (A) Effective photochemical quantum yield of PS II, Y(II). (B) Quantum yield of regulated energy dissipation of PS II, Y(NPQ). (C) Quantum yield of non-regulated energy dissipation of PS II, Y(NO). Detached leaves were illuminated with actinic light (550 µmol m−2 s−1) for 280 s, followed by recovery in darkness for 280 s. Saturation pulse was applied in every 20 s. (D) Quantum yield of photochemical energy conversion in PS I, Y(I). (E) Quantum yield of non-photochemical energy dissipation due to donor-side limitation of PS I, Y(ND). (F) Quantum yield of non-photochemical energy dissipation due to acceptor-side limitation of PS I, Y(NA). Detached leaves were illuminated with actinic light (120 µmol m−2 s−1) for 5 min for the activation of Calvin–Benson–Bassham cycle before the measurement of maximal P700 signals. Three independent biological replicates were used in the experiment, each having four technical replicates. Error bars indicate SEM. Student's t-test was used to show statistical differences. *P < 0.05; **P < 0.01; ***P < 0.001; **** < 0.0001.

