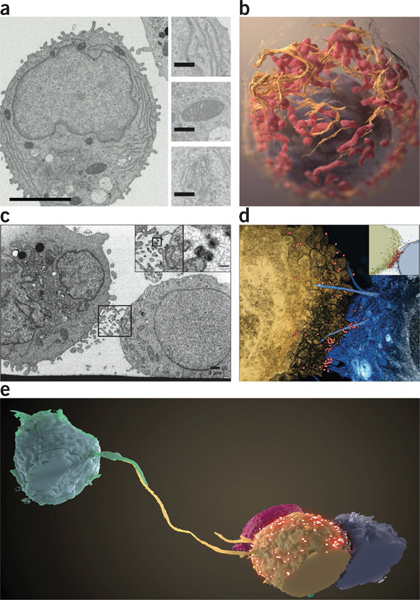
Figure 2 |.

Visualizing cells and cell-cell contacts in three dimensions. (a,b) Stacks of FIB-SEM images rich in ultrastructural detail (a; inset: top, endoplasmic reticulum; middle, mitochondria; bottom, Golgi) can be segmented to reveal cellular structures in three dimensions (b; nucleus, purple; endoplasmic reticulum, orange; mitochondria, red)60. Scale bars, 3 mm (left), 400 nm (insets). (c,d) Slice from an FIB-SEM image stack (c) and segmentation of 3D volume (d) of a T cell-astrocyte virological synapse showing HIV virions (boxed and insets) appearing to surf ‘bridges’ between the cells. Scale bars, 1 μm (inset, 100 nm). (e) Long filopodia connecting distant T cells and potentially serving as conduits for HIV transmission, as captured by FIB-SEM55. Panel a reprinted from Journal of Structural Biology, Vol. 185, Narayan, K. et al, “Multi-resolution correlative focused ion beam scanning electron microscopy; applications to cell biology,” 278–284, Copyright 2014, with permission from Elsevier. Panel b reprinted from Journal of Structural Biology, Vol. 166, Heymann, J.A. et al, “3D imaging of mammalian cells with ion-abrasion scanning electron microscopy,” 1–7, Copyright 2009, with permission from Elsevier. Panels c–e copyright © American Society for Microbiology (Journal of Virology, Vol. 88, 2014, 10327–10339, doi:10.1128/JVI.00788-14).
