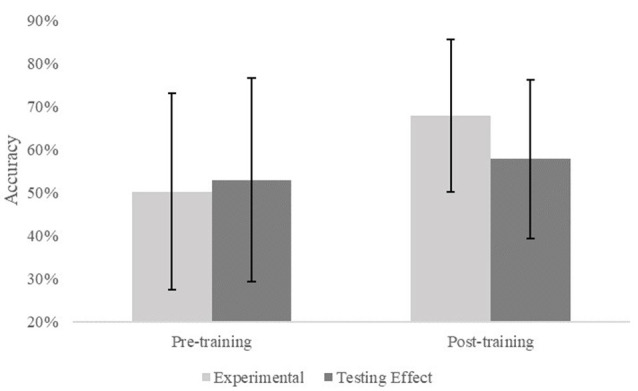
Figure 6.

Estimated marginal means of the interaction effect from a repeated-measures analysis of covariance (RMANCOVA) conducted on the SCT comparing pre-training accuracy scores in the training group [M = 0.502, 95% CI (0.616, 0.388)] and testing effect group [M = 0.529, 95% CI (0.618, 0.440)] to post-training accuracy scores in the training group [M = 0.679, 95% CI (0.798, 0.561)] and testing effect group [M = 0.578, 95% CI (0.617, 0.486)] after accounting for age as a covariate. Error bars show 95% confidence intervals.
