
Figure 2. Reconstitution of Complexes Containing Cse4/H4 and Scm3 on Centromere DNA.
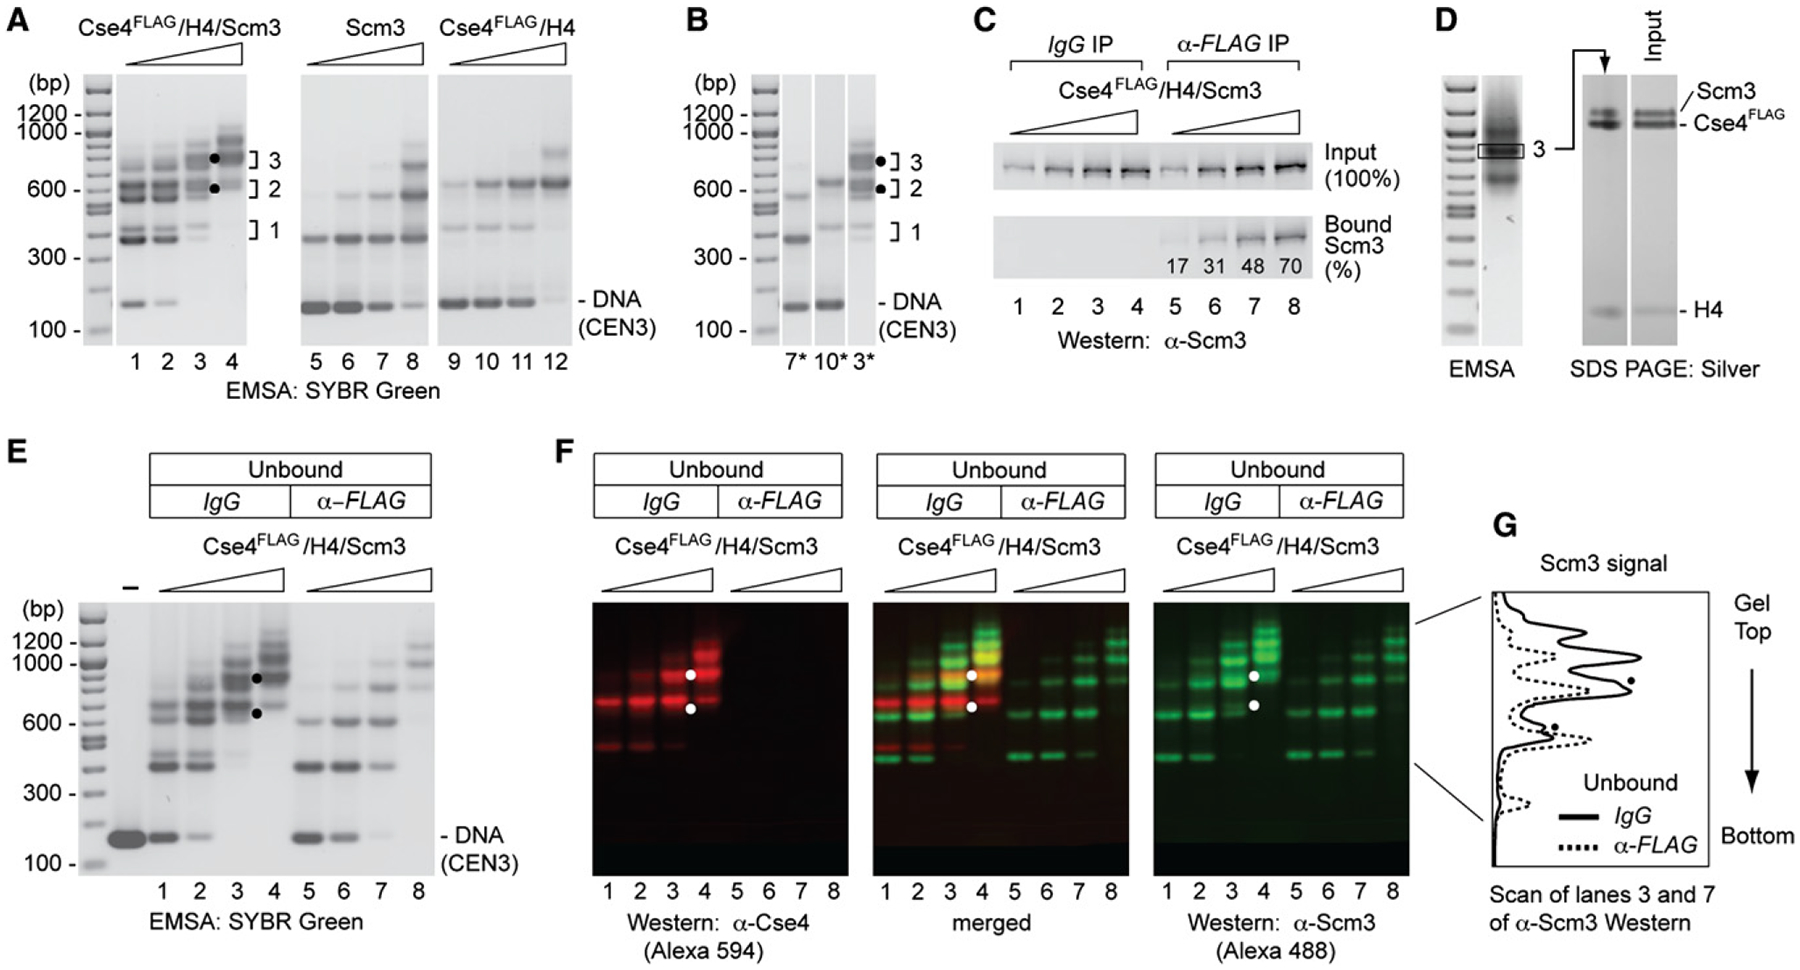
(A) Complexes were reconstituted by salt dialysis using CEN3 DNA (148 bp) and increasing amounts of Cse4FLAG/H4/Scm3 hexamers, and analyzed by EMSA and SYBR Green staining: lanes 1–4, Cse4FLAG/H4/Scm3 (protein:DNA molar ratio, rm = 0.3, 0.6, 0.9, 1.2); lanes 5–8, Scm3 (rm, = 0.125, 0.25, 0.5, 1.0); lanes 9–12, Cse4FLAG/H4 (rm = 0.27, 0.55, 1.1, and 2.2). Dots mark distinctly resolved complexes that may contain both Scm3 and Cse4FLAG (see also D–F). Brackets and numbers indicate rungs of the doublet ladders of band-shift species.
(B) Comparison of lanes 3, 7, and 10 in (A).
(C and D) Scm3 and Cse4 reside in the same DNA-protein complexes. Complexes were reconstituted as in (A) and analyzed for the presence of Scm3 and Cse4.
(C) shows percent Scm3 associated with Cse4 as analyzed by α-FLAG immunoprecipitation and western blotting. (D) shows SDS-PAGE and silver staining of a band-shift species excised from an EMSA gel. Density scan shows a Scm3:Cse4 ratio of 0.86 after normalization to that of input.
(E) Scm3-DNA complexes in the α-FLAG unbound fraction shown by EMSA and SYBR Green staining (lanes 5–8).
(F) Cse4- and Scm3-containing complexes confirmed by western blot analysis of a replicate gel as in (E), probing with α-Cse4 (rabbit) and α-Scm3 (guinea pig) antibodies, and visualized by fluorescent Alexa Fluor 594 goat-anti-rabbit and Alexa Fluor 488 goat-anti-guinea pig, respectively. Dots mark distinctly resolved complexes that are depleted by α-FLAG and therefore contain both Scm3 and Cse4FLAG.
(G) Signal intensity scans of gel lanes 3 and 7 of α-Scm3 western blot of (F) (α-FLAG IP exacerbates Cse4FLAG/H4/Scm3 dissociation, as revealed by the relative increase of the first and second mobility shifts for Cse4-free Scm3).