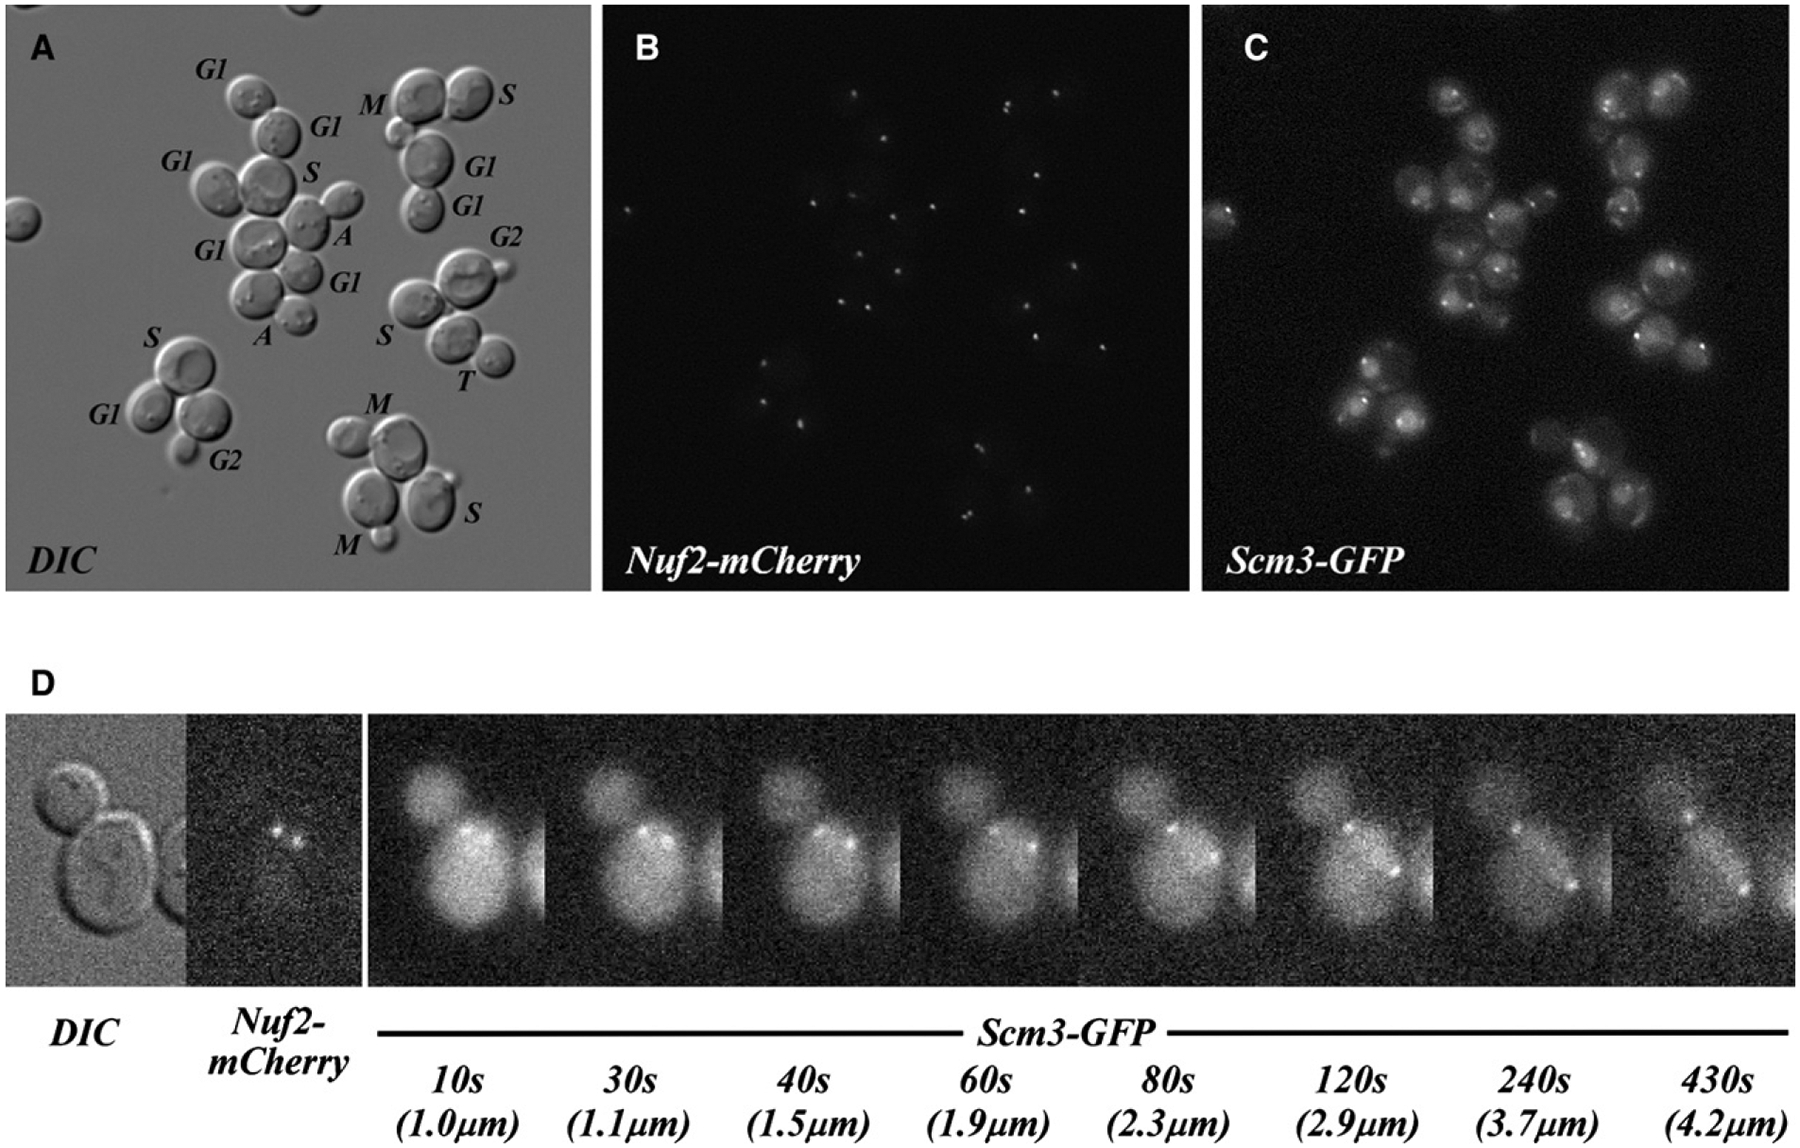
Figure 5. Scm3 Is Enriched at Centromere Clusters throughout Cell Cycle.

(A) DIC image of live asynchronous cells coexpressing Scm3-GFP and Nuf2-mCherry (as sole gene copies). The central plane of the Z stack is depicted. Cell cycle stages were assigned by inspection of all image planes, the position of centromeres, and the orientation of nuclei, as revealed in (B) and (C) (M, metaphase; A, anaphase; T, telophase). In a separate analysis of live, asynchronous cells, all 2069 cells examined showed centromeric enrichment of Scm3-GFP in addition to diffuse nuclear fluorescence.
(B) Compressed Z stack showing localization of the Nuf2-mCherry centromere marker.
(C) Compressed Z stack showing localization of Scm3-GFP in the same cells. To allow comparison between images, the brightness of (B) and (C) was linearly scaled within the same range of the original 16-bit signal registered by the camera. Slight differences in the positions of individual Nuf2 and Scm3 foci are consistent with observed movements of centromeres during sequential imaging.
(D) Selected frames from time-lapse series of a Scm3-GFP- and Nuf2-mCherry-expressing cell undergoing anaphase (enlarged 2×). DIC and Nuf2-mCherry images at the start are shown, followed by Scm3-GFP images at the indicated elapsed times (Scm3-GFP is enriched on both centromere clusters in all consecutive frames taken 10 s apart, for 650 s). Images (0.5 s exposure) were obtained in EM-CCD mode (EM gain = 100). Elapsed time (seconds) and the separation between centromere clusters (μm) are indicated.
