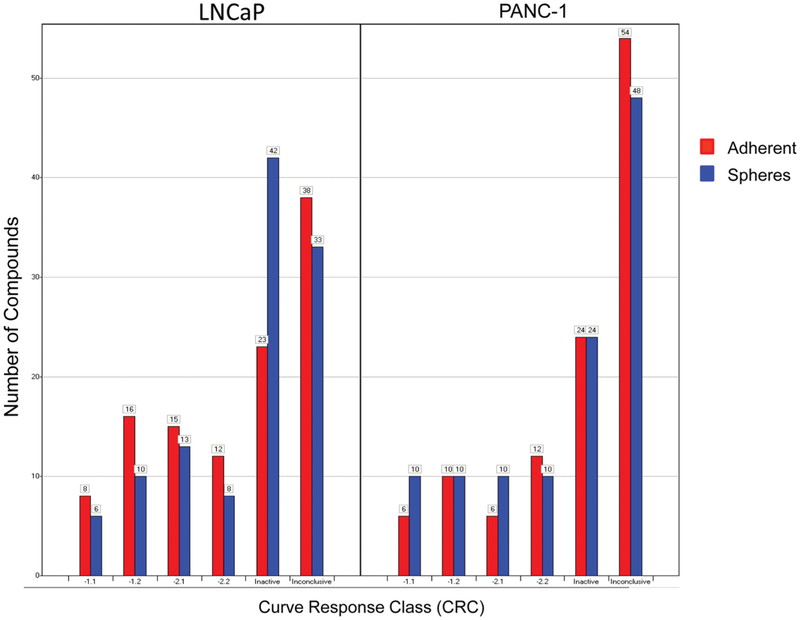
Figure 2.
Results from quantitative high-throughput screening analyzed using curve response class (CRC) fitting, showing the CRC distribution of the number of compounds from both the LNCaP and PANC1 cell lines for both adherent (red) and sphere (blue) populations. CRCs −1.1, −1.2, −2.1, and −2.2 are considered active, and CRC 4 is inactive. All other groups are clustered as inconclusive. A more detailed description of the CRCs can be found in the Supplemental Methods section and referenced in Inglese et al.20 and Wang et al.21

