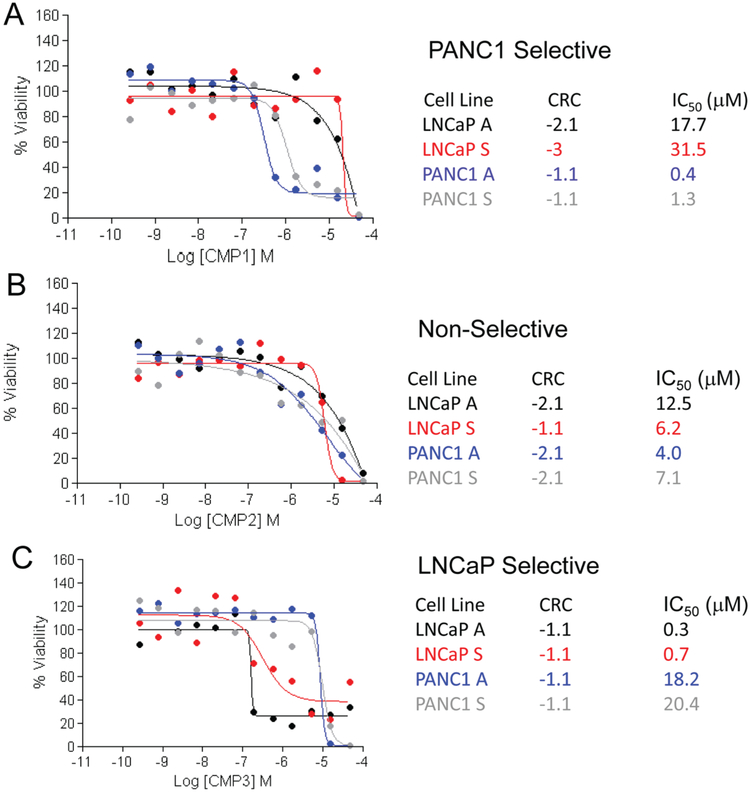
Figure 3.
Dose-response curves of (A) CMP1, (B) CMP2, and (C) CMP3 with curve response class (CRC) score and predicted IC50 values from the screen for cell proliferation in adherent LNCaP (black), LNCaP spheres (red), adherent PANC1 (blue), and PANC1 spheres (gray). Percent viability compared with DMSO control-treated cells appears on the y-axis and the log molar concentration on the x-axis. CMP1 was identified using the % viability method, CMP2 was identified using both % viability and CRCs, and CMP3 was identified by CRC analysis only.

