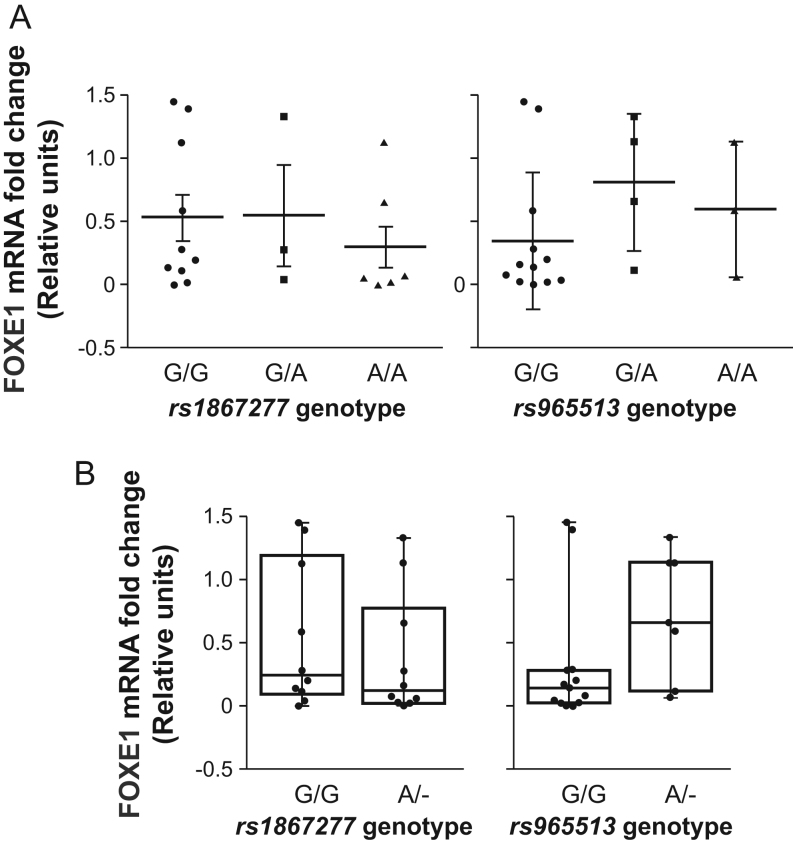
Figure 3.
No correlation between single nucleotide polymorphism genotypes and FOXE1 expression levels. (A) Representation of correlation of FOXE1 mRNA expression and genotypes (GG, AG, or AA) of rs1867277 and rs965513. Values represent mean ± s.e.m. (B) Box plot of FOXE1 mRNA expression in thyroid cancer cell lines vs genotypes with or without risk allele A of rs1867277 and rs965513. Values represent mean ± max to min.

 This work is licensed under a