Figure 4.
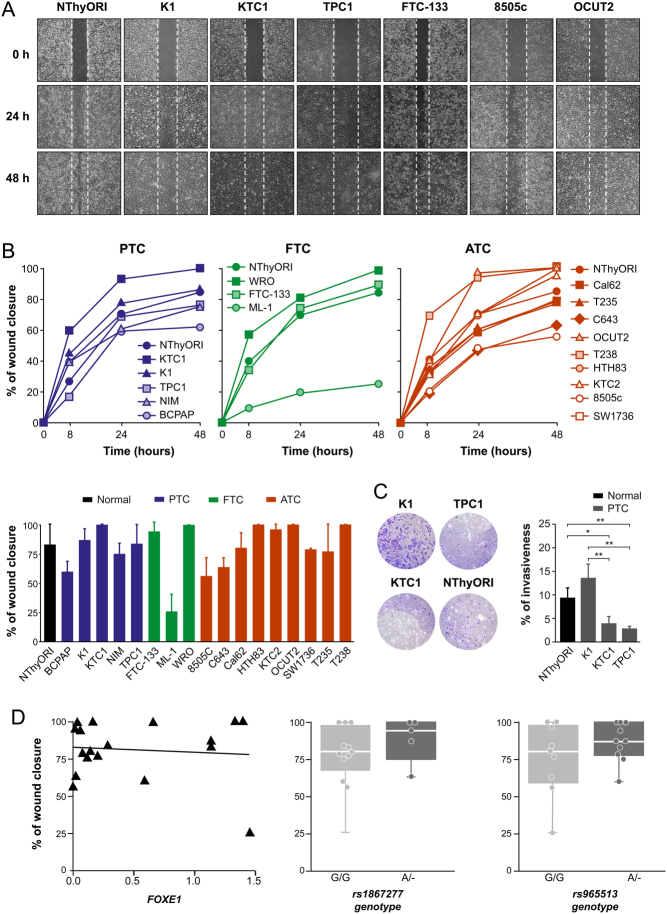
Analysis of thyroid cancer cell migration and invasion. (A) Representative images of wound-healing assay of PTC cell lines: K1, KTC1, and TPC1; FTC cell line: FTC-133; ATC cell lines: 8505c, OCUT2 and NThyORI cells. (B) Time course of wound closure in PTC-, FTC-, and ATC-derived cells. Cells were photographed at 0, 8, 24 and 48 h, and wound closure area was quantified using ImageJ software. Bar graph shows wound closure after 48 h of migration. Values represent mean ± s.e.m. of the percentage of the closure of original wound from three independent experiments performed in triplicate. (C) NThyORI, K1, KTC1, and TPC1 cells were seeded in the upper chambers of Transwells, allowed to migrate for 18 h, and photographed. Left: representative images of the lower chamber (invading cells). Right: percentage of invasiveness by direct measurement with ImageJ. Values represent mean ± s.e.m. from three independent experiments performed in triplicate. *P < 0.05, **P < 0.01. (D) Correlation analysis between migration, SNP genotype, and FOXE1 expression levels. Left: representation of correlation between wound closure and levels of FOXE1 (Pearson r = −0.091). Center and Right: representation of the correlation between wound closure and genotype in rs1867277 and rs965513 (G/G; –/A).

 This work is licensed under a