Figure 7.
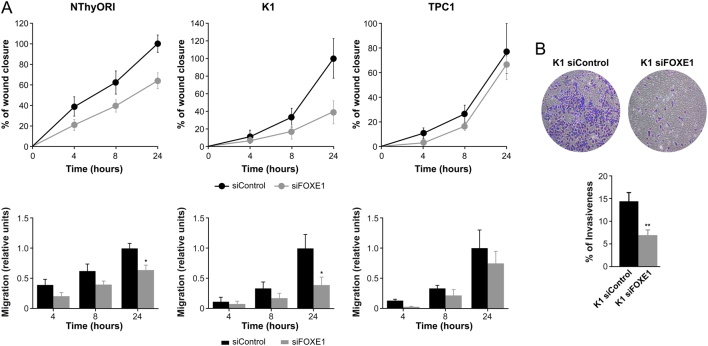
FOXE1 modulates migration and invasion in thyroid cancer cells. (A) Time course of wound closure in NThyORI, K1, and TPC1 cells silenced or not for FOXE1 expression (upper panel). Cells were photographed at 0, 4, 8, and 24 h, and wound closure area was quantified using ImageJ software. Quantification of migration rates in FOXE1-silenced cells vs control cells are shown in lower panel. Bar graph shows migration after 4, 8, and 24 h. (B) Invasiveness of K1 cells after FOXE1 silencing. Top: representative images of the lower chamber (invading cells). Bottom: percentage of invasiveness relative to siControl cells. Values represent mean ± s.e.m. from three independent experiments *P < 0.05, **P < 0.01. A full color version of this figure is available at https://doi.org/10.1530/ERC-19-0156.

 This work is licensed under a