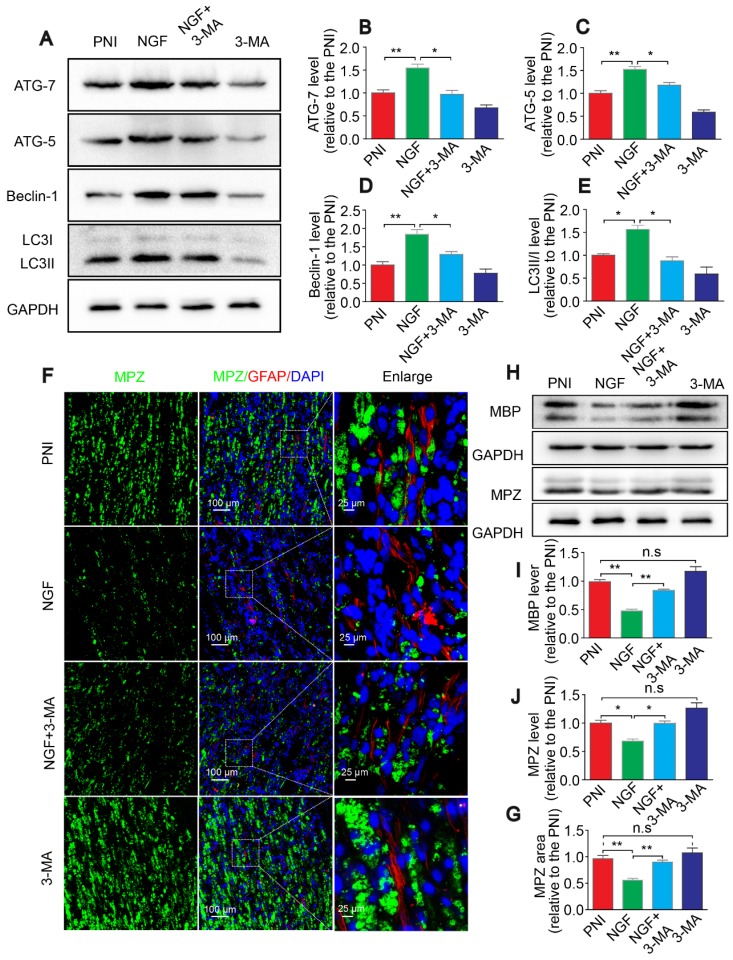
Figure 12.
Autophagy inhibition delays myelin degradation. (A-E) Representative immunoblots and quantification of ATG-7, ATG-5, Beclin-1 and LC3 from sciatic nerves of the PNI, NGF, NGF+3-MA and 3-MA groups at 5 days post crush. Data are presented as the mean ± SEM; n = 3 independent experiments. ATG-7 F(3, 8) = 22.16, **PPNI vs NGF = 0.0076, *PNGF vs NGF+3-MA = 0.019; ATG-5 F(3, 8) = 46.66, **PPNI vs NGF = 0.0036, *PNGF vs NGF+3-MA = 0.027; Beclin-1 F(3, 8) = 18.80, **PPNI vs NGF = 0.0075, *PNGF vs NGF+3-MA = 0.038; LC3II/I F(3, 8) = 16.85, *PPNI vs NGF = 0.039, *PNGF vs NGF+3-MA = 0.012. (F, G) Representative micrographs showing double immunofluorescence with MPZ (green) and GFAP (red). Nuclei are stained with DAPI (blue) in each group. Quantitation of the MPZ positive area is also shown. Data are presented as the mean ± SEM; n = 3 rats per group. F(3, 8) = 13.37, **PPNI vs NGF = 0.0057, **PNGF vs NGF+3-MA = 0.0054, PPNI vs 3-MA = 0.39 (n.s). (H-J) MBP and MPZ protein levels and quantitative analysis. Data are presented as the mean ± SEM; n = 3 independent experiments. MBP F(3, 8) = 44.72, **PPNI vs NGF = 0.0074, **PNGF vs NGF+3-MA = 0.0056, PPNI vs 3-MA = 0.11 (n.s); MPZ F(3, 8) = 31.98, *PPNI vs NGF = 0.036, *PNGF vs NGF+3-MA = 0.012, PPNI vs 3-MA = 0.090 (n.s).

