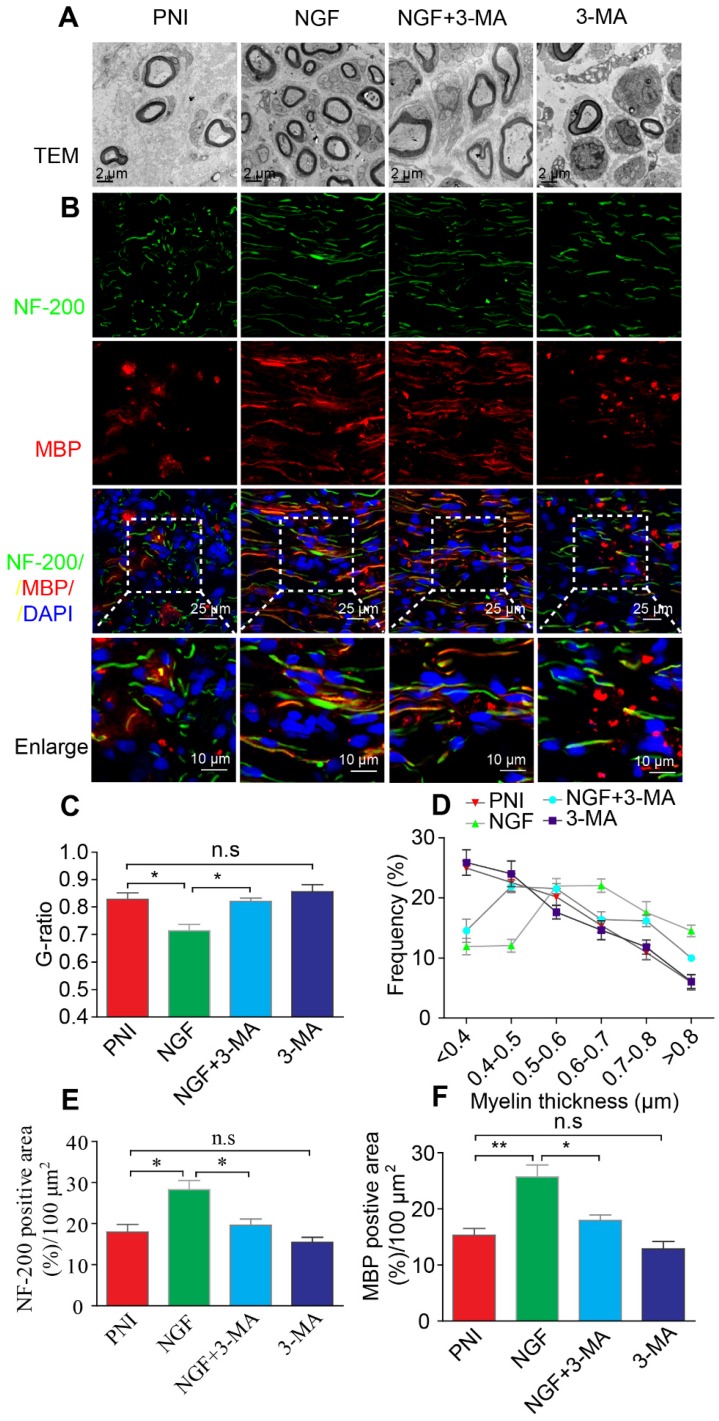
Figure 13.
Autophagy inhibition suppresses nerve regeneration. (A, B) Electron micrographs and co-immunofluorescence of NF-200 (green) and MBP (red) analysis were performed in the four groups at 14 days after PNI. Nuclei are stained with DAPI (blue). (C-F) Statistical analysis of the G-ratio, distribution of myelin thickness, and NF-200 and MBP positive staining areas on the proximal nerve lesions in each group. Data are presented as the mean ± SEM; n = 3 rats per group. G-ratio F(3, 8) = 8.23, *PPNI vs NGF = 0.039, *PNGF vs NGF+3-MA = 0.040, PPNI vs 3-MA = 0.49 (n.s); NF-200 F(3, 8) = 10.17, *PPNI vs NGF = 0.042, *PNGF vs NGF+3-MA = 0.048, PPNI vs 3-MA = 0.35 (n.s); MBP F(3, 8) = 13.91, **PPNI vs NGF = 0.005, *PNGF vs NGF+3-MA = 0.039, PPNI vs 3-MA = 0.058 (n.s).

