Figure 14.
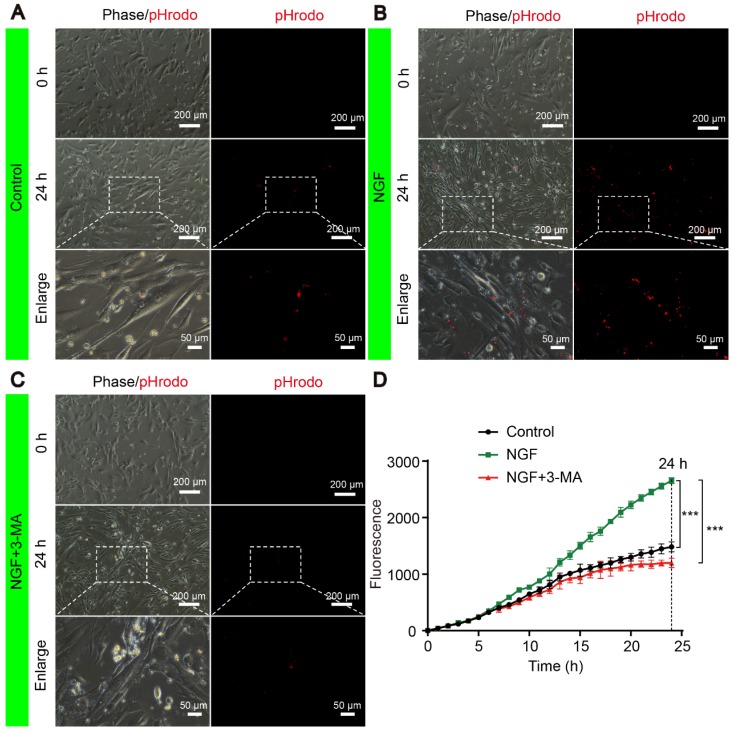
NGF enhances myelin phagocytosis in primary Schwann cells. (A-C) Cells were purchased and cultured as described in Materials and Methods. Cells were treated with either vehicle control (A), or 50 ng mL-1 NGF (B) or 50 ng mL-1 NGF for 6 hrs followed by the addition of 3-MA (C). Representative phase and fluorescent images of primary SCs at 0 h and 24 h for each condition are shown. An magnified inset for each treatment group is also presented to show the pHrodo-labeled myelin debris were inside of primary SCs. (D) The signals of integrated fluorescence intensity of internalized pHrodo-labeled myelin debris were measured and shown. n = 5 picture frames for each group per time point. Data are presented as mean ± SEM. T = 24 h F(2, 12) = 118.84, ***Pcontrol vs NGF < 0.001, ***PNGF vs NGF+3-MA < 0.001.

