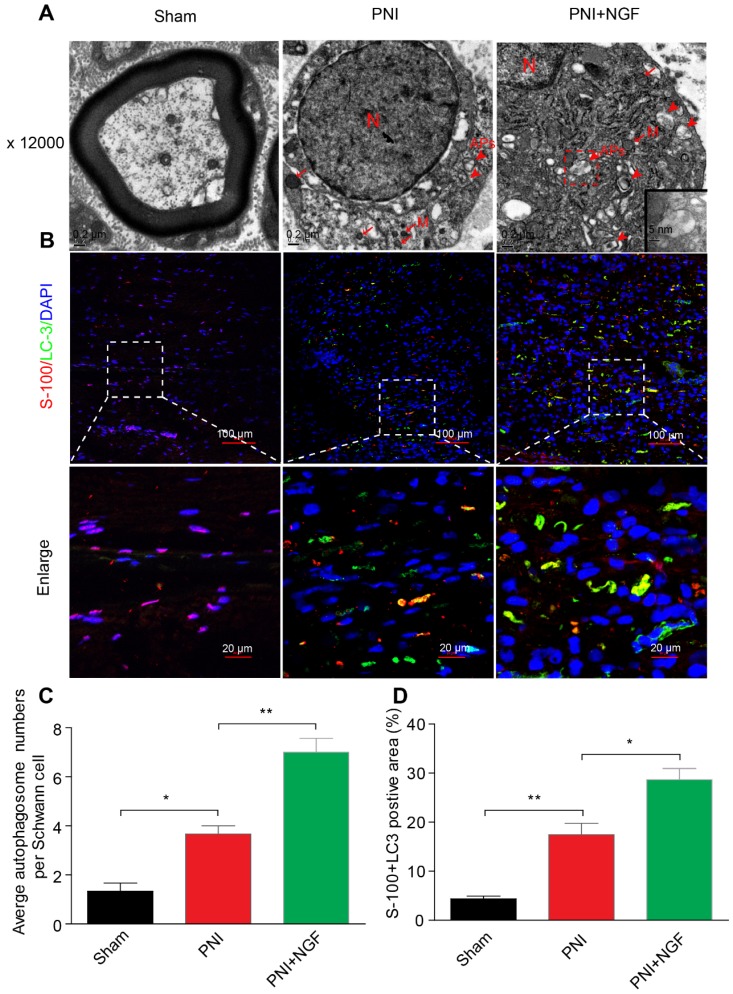
Figure 6.
NGF mediates the enhancement of autophagy in SCs. (A) Transmission electronic microscopy images show numerous autophagosomes in the sham, PNI and PNI+NGF groups on postoperative day 5. APs: autophagosome (arrowheads); M: mitochondria (arrow); N: nucleus. The autophagosome is shown at high magnification in the inset. (B) Double immunofluorescence staining of LC3 protein (green) with S-100 positive dots (red) was detected in all groups at P5. Nuclei are counterstained with DAPI (blue). (C) Qualitative analysis of the average number of autophagosomes per Schwann cell from (A). Data are presented as the mean ± SEM; n = 5 rats per group. F(2, 12) = 43.80, *Psham vs PNI = 0.015, **PPNI vs PNI+NGF = 0.0082. (D) Quantification of the percent of S-100 colocalization with LC3 in the lesion area of sciatic nerves from (B). Data are presented as the mean ± SEM; n = 3 rats per group. F(2, 6) = 40.08, **Psham vs PNI = 0.0074, *PPNI vs PNI+NGF = 0.038.

