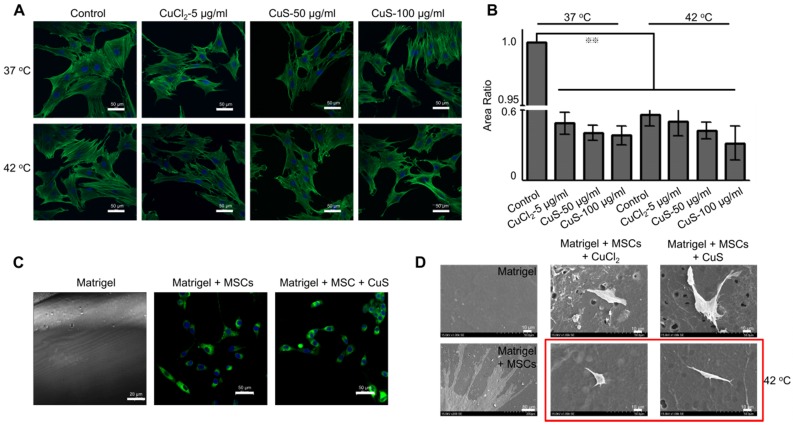
Figure 2.
The differentiation of MSCs treated with CuS@BSA. Immunofluorescence images of β-actin in MSCs incubated in different concentrations of CuS@BSA for 48 h. (Blue: Nucleus; Green: β-actin. Scale bar = 50 μm). B) The area of MSCs were measured by ImageJ (**P < 0.01 by Student's t-test). C) Reflectance confocal image of Matrigel at 12-18 mg/ml (Scale bar =10 μm) and fluorescence images of MSCs infected with lentivirus carrying EGFP and Luciferase (Blue: Nucleus; Green: GFP. Scale bar =50 μm). D) SEM image of Matrigel and MSCs cultured in Matrigel with CuS@BSA and CuCl2, scale bar =10 μm.

