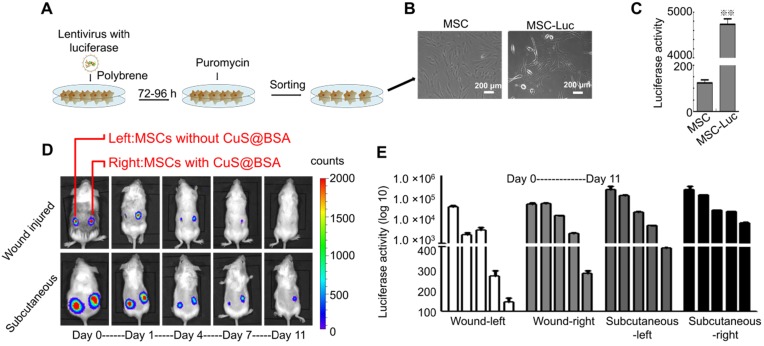
Figure 4.
The identification of MSC transfected with GFP and luciferase. A) The scheme of the lentivirus infection process. B) The images of MSCs and MSCs transfected with lentivirus (Scale bar = 200 μm). C) The luciferase activity of MSCs and MSCs transfected with lentivirus detected by D-Luciferin sodium salt using a microplate reader (**P < 0.01 by Student's t-test). D) Bioluminescence images of BALB/c mice seeded with Matrigel and MSCs-luciferase at day 0,1,4,7,11 (Left: MSC without CuS@BSA, Right: MSC with CuS@BSA). E) The quantified fluorescence intensity of MSCs-luciferase in vivo.

