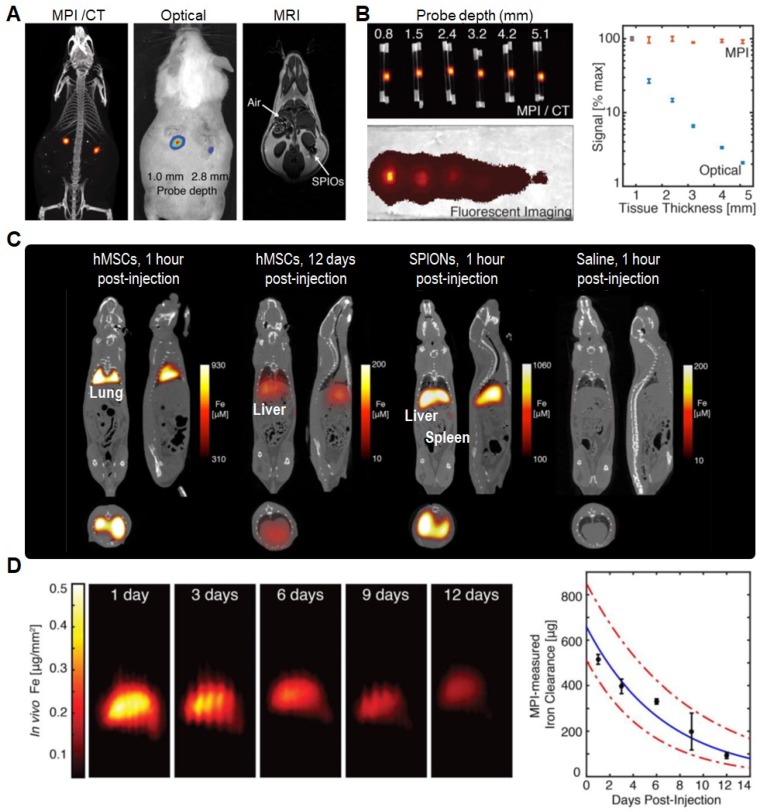
Figure 3.
(A) Comparison of MPI/CT, fluorescence imaging, and MRI in mouse. (B) Quantitative comparison of MPI and fluorescent signal in different tissue depths. (C) MPI/CT imaging of mice intravenously injected with hMSCs, SPIONs, and saline. (D) MPI quantification of in vivo SPIONs clearance upon hMSCs injections. Reprinted with permission from 47, copyright 2016 Ivyspring.

