Figure 1.
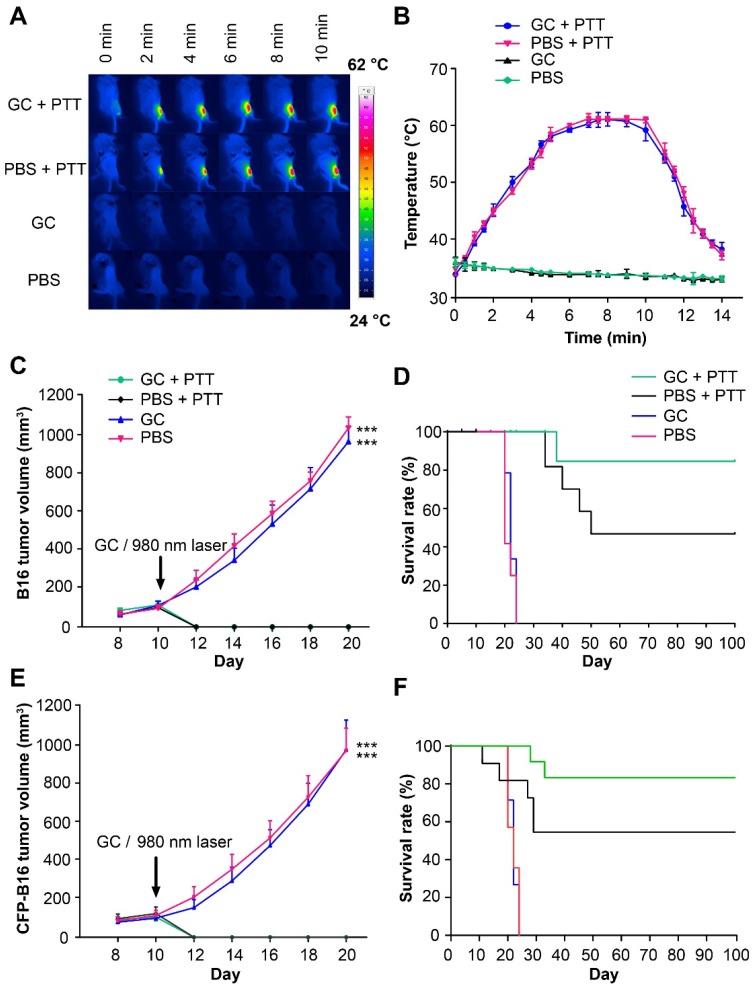
The treatments of subcutaneous B16 and CFP-B16 tumors. (A) Infrared (IR) thermal images of mice bearing CFP-B16 tumors under different treatments (GC + PTT, PBS + PTT, GC, or PBS). (B) Tumor temperature changes based on IR thermal imaging data in (A). Data are presented as mean ± SD (n = 3 mice). (C) Volume of B16 tumors in the mice of different treatment groups. Data are presented as mean ± SD (n = 9-10 mice, two independent experiments, PBS versus GC + PTT, *** P < 0.001, and GC versus GC + PTT, *** P < 0.001). (D) Survival rates of mice bearing B16 tumors after various treatments (9-10 mice per group). (E) Volume of CFP-B16 tumors in the mice of different treatment groups. Data are presented as mean ± SD (n = 10 mice, two independent experiments, GC + PTT versus PBS, *** P < 0.001, and GC + PTT versus GC, *** P < 0.001). (F) Survival rates of mice bearing CFP-B16 tumors after various treatments (10 mice per group). Statistical analysis was performed using the Kruskal-Wallis test followed by Dunn's multiple comparison tests and the log-rank Mantel-Cox test.

