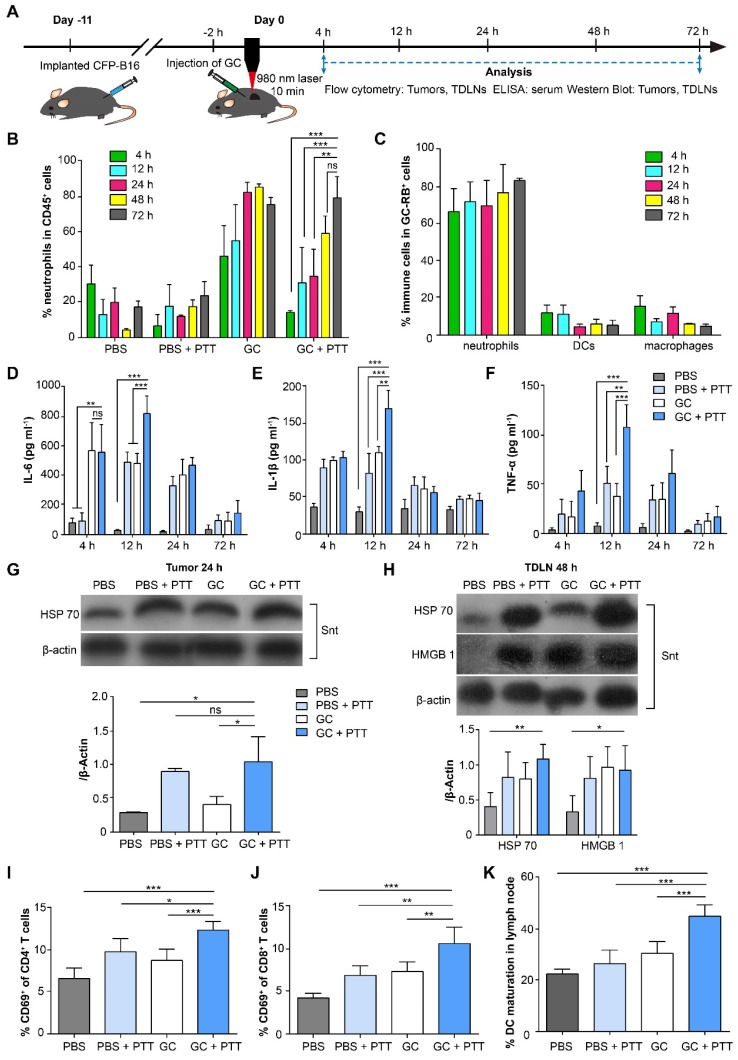
Figure 2.
Immunological responses induced by LIT in the tumors, serum, and TDLNs. (A) Schematics of the procedures and timeline of GC + PTT treatment for CFP-B16 and analysis of LIT-induced antitumor immune response. (B) Proportions of neutrophils in immune cells in the treated primary tumors after various treatments at different times. (C) Proportions of neutrophils in immune cells with GC-RB (gated by CD45+ and RB+) in the tumors treated with GC-RB + PTT at different times. Data are presented as mean ± SD (n = 3-5 mice, two independent experiments). (D-F) Cytokine levels in serum (TNF-α, IL-6, and IL-1β) from mice at different times after various treatments. Data are presented as mean ± SD (n = 3-4 mice, two independent experiments). (G) HSP70 protein expression in the treated primary tumors 24 h after various treatments was analyzed using WB. (H) HSP70 and HMGB1 expressions in TDLNs at 48 h after different treatments were analyzed using WB (n = 3, two independent experiments). (I, J) The frequency of CD69+ in the CD4+ (I) and CD8+ (J) T cells of TDLNs 24 h after different treatments. (K) The frequency of mature DCs (CD11c+CD80+CD86+) in TDLNs 72 h after various treatments. Data are presented as mean ± SD (n = 4-7 mice, three independent experiments). Statistical analysis was performed using the unpaired t-test, and the one-way ANOVA test followed by the Bonferroni post-test. * P < 0.05, ** P < 0.01, *** P < 0.001, ns: not significant.

