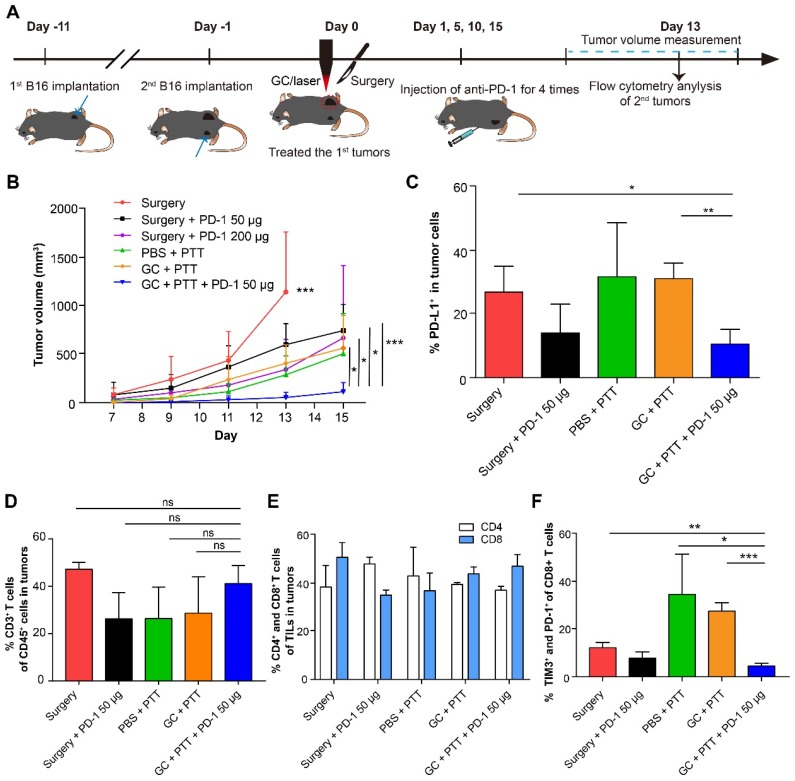
Figure 6.
Synergistic inhibitory effect of LIT combined anti-PD-1 for distant secondary B16 tumors. (A) Schematics of the procedures and timeline of LIT combined with anti-PD-1 to treat primary and secondary B16 tumors. (B) Tumor growth curves (both flanks) in different groups. Data are presented as mean ± SD (n = 6-7 mice). (C) Percentage of PD-L1+ cells in the secondary tumor cells 13 days after different treatments of the first tumors. (D) Percentage of CD3+ T cells (TILs) in the CD45+ immune cells in the secondary tumors after various treatments. (E) Percentage of CD4+ and CD8+ T cells in TILs from (D). (F) Percentage of TIM3+ and PD-1+ cells in CD8+ T cells from (E). Data are presented as mean ± SD (n = 3-4 mice). Statistical analysis was performed using the unpaired t-test, or Mann-Whitney test (nonparametric). * P < 0.05, ** P < 0.01, *** P < 0.001, ns: not significant.

