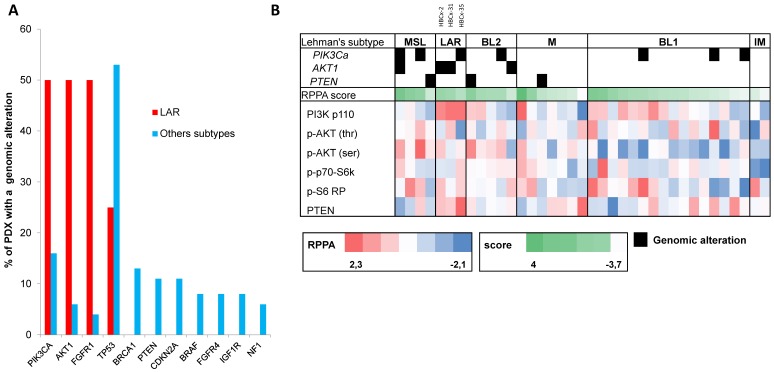
Figure 3.
Genomic alterations and activation of PIK3/AKT pathway in LAR PDX as compared to the other TNBC subtypes. (A) Percentage of genomic alterations (mutations, amplification and homozygous deletions) in TNBC PDX. (B) Heatmap representing PIK3CA, AKT1 and PTEN genomic alterations and expression of PI3Kp110, P-AKT, P-p70-S6K, P-S6 RP and PTEN proteins determined by RPPA analysis in the 37 TNBC PDX. RPPA activation score was determined by calculating the sum of the different protein components. (3 LAR models =HBCx-2, HBCx-31, HBCx-35)

