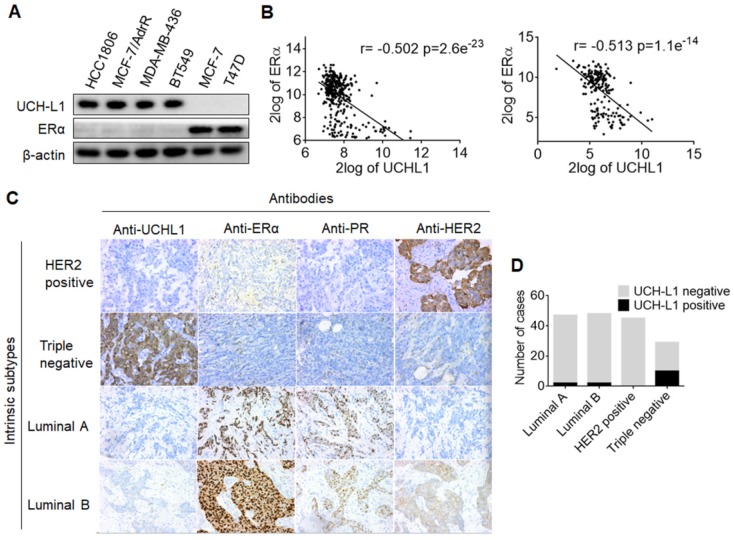
Figure 1.
The converse correlation between UCH-L1 and ERα. (A) The expressions of UCH-L1 and ERα in ERα (-) and ERα (+) breast cancer cells were measured by western blot. β-actin was used as a loading control. (B) Correlation between UCHL1 and ERα mRNA levels in GSE30682 (left) and GSE7390 (right) breast cancer samples. (C) A total of 169 clinical human breast carcinoma cases were subjected to immunohistochemical analyses with UCH-L1 antibody. The UCH-L1 expressions in representative tumor tissues including luminal A, luminal B, triple negative, and HER2 overexpression. (D) Immunohistochemical analyses of UCH-L1 expression in patients specimens.

