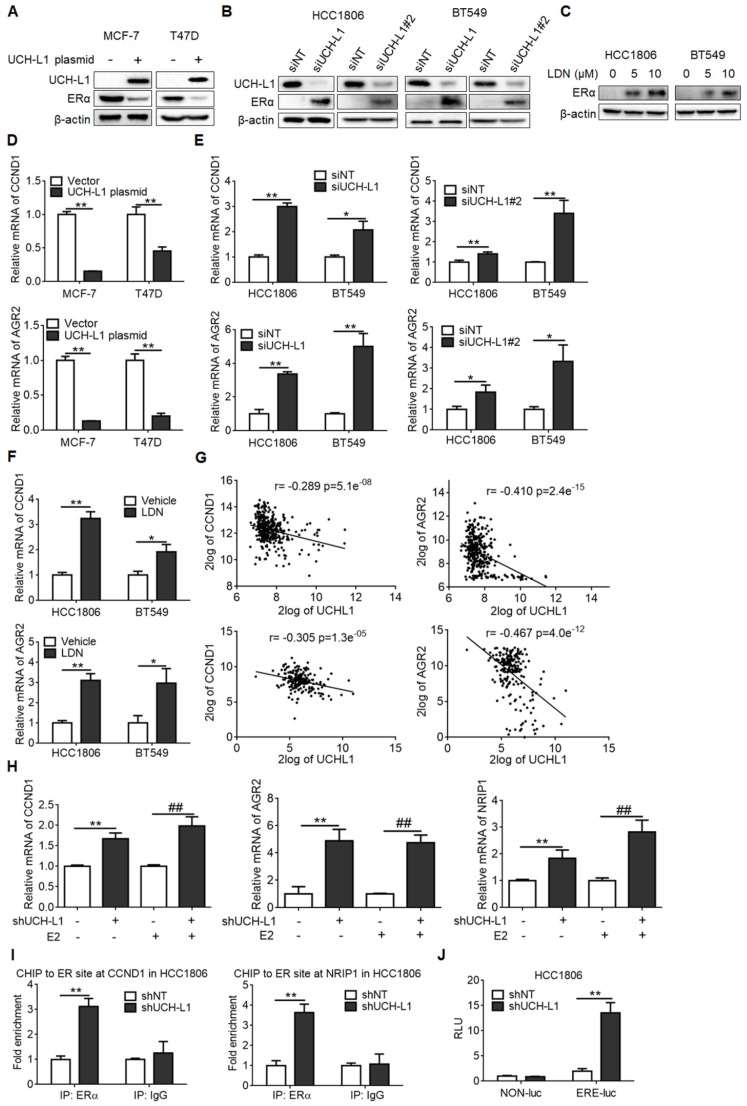
Figure 2.
UCH-L1 negatively regulates ERα in breast cancer cells. (A) MCF-7 or T47D cells were transfected with a control plasmid or a myc-his-UCH-L1 plasmid for 48h. (B and C) HCC1806 or BT549 cells were transfected with a non-targeting siRNA or UCH-L1 siRNAs for 72h (B), or were treated with UCH-L1 inhibitor LDN with the indicated concentrations for 24h (C). The expressions of UCH-L1 and ERα were measured by western blot. β-actin was used as a loading control. (D) MCF-7 or T47D cells were transfected with a control plasmid or a myc-his-UCH-L1 plasmid for 48h. (E and F) HCC1806 or BT549 cells were transfected with a non-targeting siRNA or UCH-L1 siRNAs for 72h (E), or were treated with 10 μM LDN for 24h (F). The mRNA levels of CCND1 and AGR2 were analyzed by real-time PCR (Mean ± s.d., n=3 biologically independent experiments. ∗, p <0.05; ∗∗, p <0.01). (G) Correlation between UCHL1 and AGR2, CCND1 mRNA levels in GSE30682 (upper) and GSE7390 (bottom) breast cancer samples. (H) The mRNA levels of ER-target genes in control or UCH-L1 knockdown HCC1806 cells following treatment with vehicle or 10nM E2 for 24 hours, were analyzed by real-time PCR (Mean ± s.d., n=3. ∗∗, p <0.01; ##, p <0.01 compared with E2). (I) ChIP-qPCR analysis. Fold enrichment of ERα at the CCND1/NRIP1 promoter regions in the presence of 10nM E2 for 24 hours (Mean ± s.d. of triplicate measurements. ∗∗, p <0.01). (J) ERE-luciferase assay in the control or UCH-L1 knockdown HCC1806 cells in the presence of 10nM E2 for 24 hours (Mean ± s.d., n=3. ∗∗, p <0.01).

