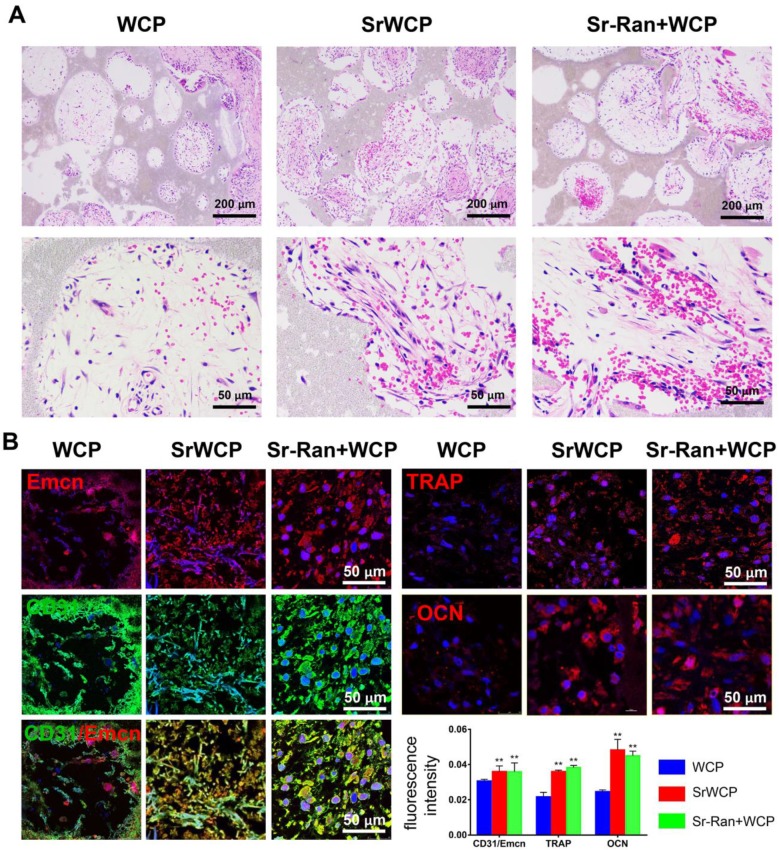
Figure 7.
Evaluation of the in vivo angiogenesis, osteogenesis and osteoclastogenesis after implantation for 1 week. (A) H&E histological images of the bioceramics with the infiltrated tissue: the first row: general view of the section; the second row: magnification of the center area of the bioceramics from each group. (B) Immunofluorescence staining: Green fluorescence indicates active CD31; red fluorescence indicates active Emcn, TRAP and OCN respectively; blue fluorescence indicates PI bound to the nuclei of cells. Quantitative analyses of the mean fluorescence intensity values of CD31, Emcn and TRAP were provided below (*p < 0.05 vs the WCP group; **p < 0.01 vs the WCP group).

