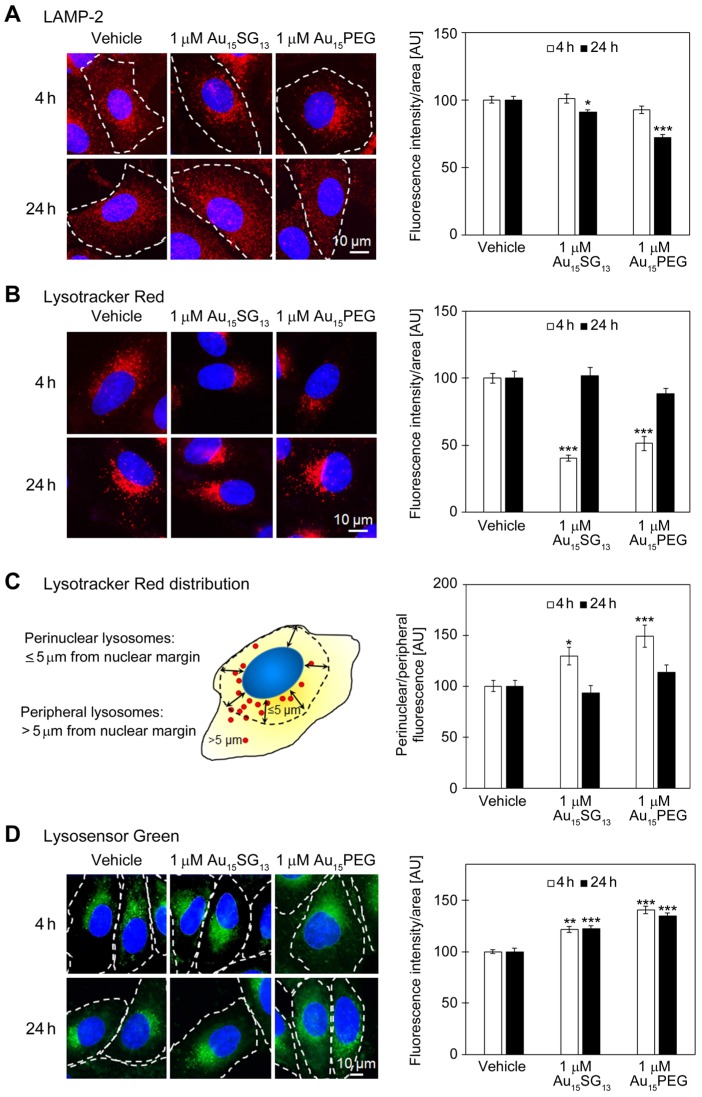
Figure 3.
Evaluation of lysosomes in U251N cells. All graphs depict results normalized to the vehicle control; data are shown as average ± SEM; *p<0.05, **p<0.01, ***p<0.001; AU, arbitrary units. (A) Detection of LAMP-2. Cells were treated with 1 μM Au15SG13 or 1 μM Au15PEG for 4 or 24 hours. LAMP-2 was located by immunocytochemistry (red); nuclei were demarcated with Hoechst 33342 (blue). Fluorescence intensities/area were quantified for at least 97 cells per condition. (B) Lysosome staining with Lysotracker Red. Cells were incubated with vehicle, 1 μM Au15SG13 or 1 μM Au15PEG for 4 or 24 hours. The bars depict the average fluorescence intensity/area ± SEM; 52 to 134 cells were assessed per condition. (C) The distribution of Lysotracker Red signals was determined for the 4- and 24-hour treatment shown in part B. The fluorescence intensities were quantified for a 5-μm area adjacent to the nuclear margin (perinuclear) and for peripheral cell regions. The ratio of perinuclear/peripheral signals was calculated for 44 to 58 cells for each condition. Results are depicted as average ± SEM. (D) Staining of U251N cells with Lysosensor Green. U251N cells treated with 1 μM Au15SG13 or 1 μM Au15PEG for 4 or 24 hours were incubated with Lysosensor Green and imaged as described in the Methods section. Graphs depict average fluorescence intensities per area ± SEM; measurements were performed for a minimum of 81 cells per condition and at least two independent experiments.

