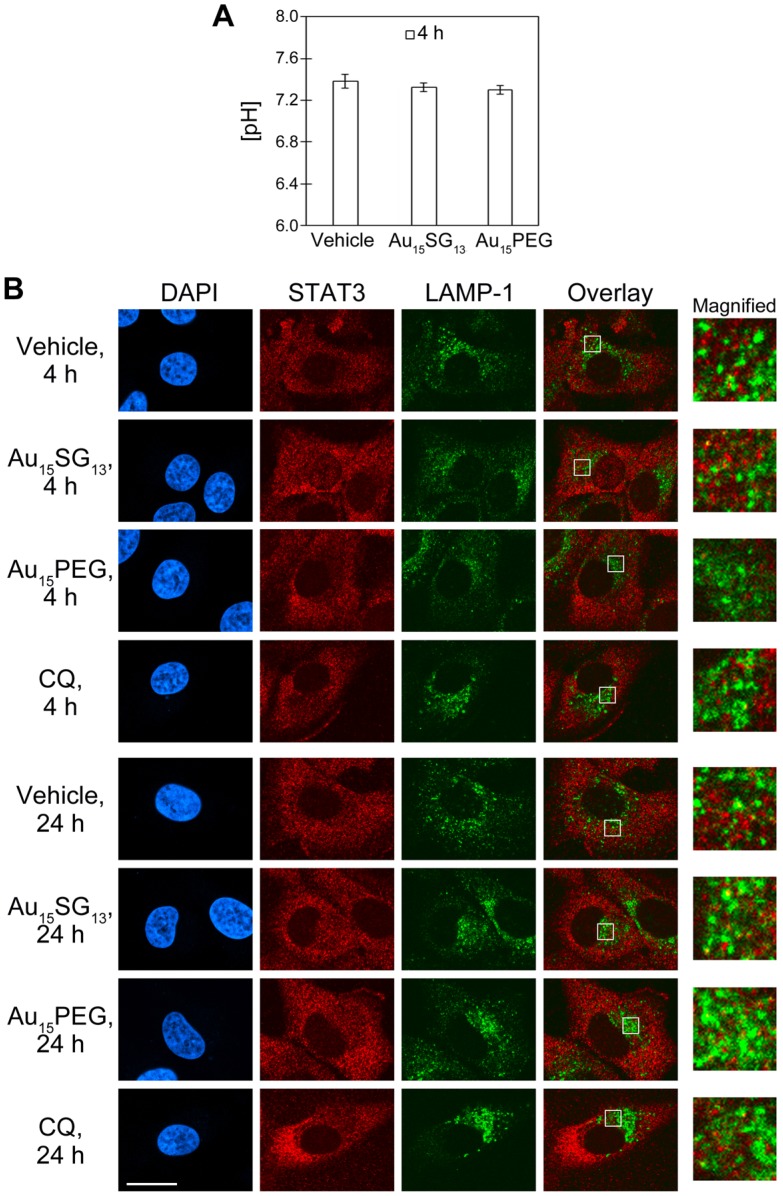
Figure 4.
(A) Ratiometric measurement of cytoplasmic pH. U251N cells were treated for 4 hours with 1 µM Au15SG13 or 1 µM Au15PEG in serum-free medium. Following treatment, cells were incubated with 5 μM SNARF®-1 in serum-free DMEM for 45 min at 37oC. The pH values were determined by ratiometric fluorescence measurements and extrapolation from the calibration curve. The graph shows averages ± SEM for one experiment with triplicate samples. (B) Subcellular distribution of STAT3 and LAMP-1. U251N cells were incubated with vehicle, 1 µM Au15SG13, 1 µM Au15PEG or 20 µM chloroquine (CQ) in serum-free medium for 4 hours or 24 hours as indicated. Cells were fixed and processed for immunocytochemistry as described in the Methods section. Scale bar is 20 µm. Selected regions of the overlay image were magnified 5-fold. Yellow color in the overlay images indicates co-localization of STAT3 and LAMP-1.

