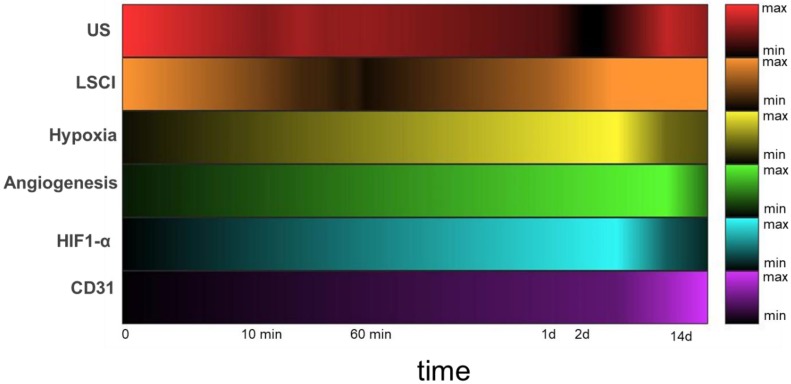
Figure 8.
Heatmaps depicting measured circulatory parameters over a log-time axis. In each case, darker colors represent lower relative measurements, and the 0 timepoint indicates pre-ligation. While US (red) measures perfusion of the deep tissue (~ 6 mm), LSCI (orange) measures perfusion within 1mm of the tissue surface. Hypoxia (yellow) and αVβ3 (green) expression were both measured using SPECT imaging with the targeted probes 99mTc-BRU-5921 and 99mTc-NC100692, respectively. HIF-1α (blue) and CD31 (purple) expression in ischemic tissue were quantified from immunohistochemistry images.

