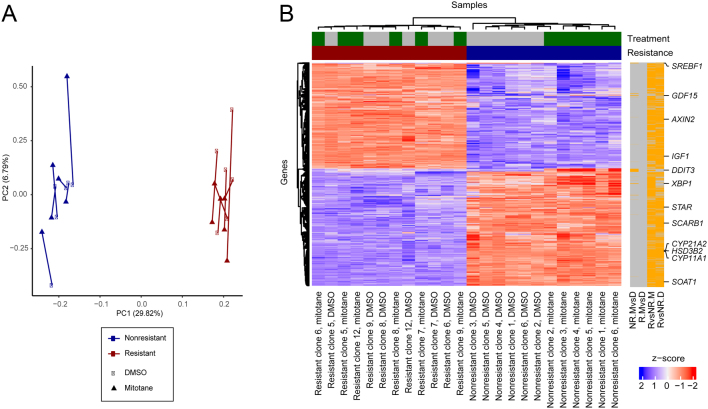
Figure 3.
(A) PCA of gene expression for resistant and nonresistant cell lines treated with DMSO or mitotane. Corresponding cell lines are connected by lines, and percentage-explained variance is given in the axis title. (B) Expression heatmap of differentially expressed genes in any of four comparisons: resistant cell lines with vs without mitotane treatment (R.MvsD; no significant changes), nonresistant cell lines with vs without treatment (NR.MvsD), resistant vs nonresistant cell lines under treatment (RvsNR.M) or without treatment (RvsNR.D). Expression data were transformed to z-scores for standardization. Significantly changed genes (5% FDR, log2 fold change cutoff 0.5) are indicated by orange bars on the right, and selected genes are highlighted.

 This work is licensed under a