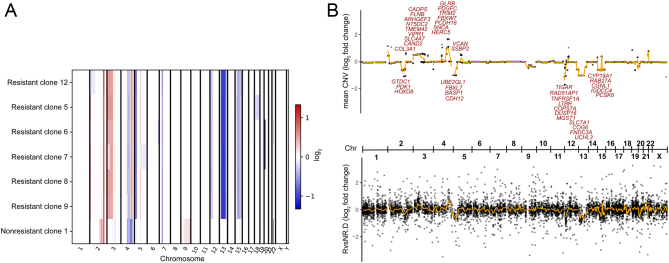
Figure 4.
(A) Copy number changes compared to founder cell line. Whole-exome sequencing data of resistant and nonresistant cell lines were compared to the founder cell line in a tumor/normal matched pair fashion to analyze copy number changes. Log2 fold changes are shown across the genome. Resistant cell lines share CNV patterns that are distinct from the control, suggesting a common cell of origin of resistant clones. (B) Comparison of average CNV to gene expression changes (resistant vs nonresistant cells). Top panel shows CNV log2 fold change per gene across the genome. Bottom panel shows log2 fold change in RNA expression between resistant and nonresistant clones (without mitotane treatment). Selected genes with consistent log2 fold changes (|CNV| > 0.5, |RNA| > 1, CNV*RNA > 0) are highlighted. Orange lines indicate smooth moving average. The overall correlation is 0.28. Chr, chromosome.

 This work is licensed under a