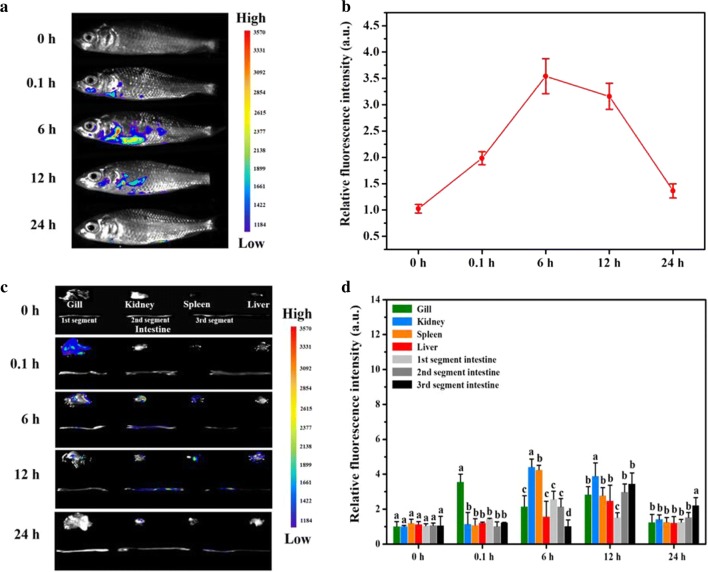
Fig. 6.
In vivo and ex vivo fluorescence images of vaccine system in vaccinated fish. a Representative in vivo fluorescence images of common carp at different time points after vaccination; b Quantitative fluorescence signals of vaccinated fish; c representative ex vivo fluorescence images of isolated fish tissues at different time points; d Quantitative fluorescence signals of different fish tissues. Data are means for three assays and represented as mean ± SD. Data at the same sampling time with different letters are significantly different (P < 0.05)

